
INITIATING COVERAGE WITH BUY RATING
Download Full Report :- Swiggy 22-09-2025
| BESTMATE INVESTMENT SERVICES PVT. LTD. Research & Analytics Division Lead Analyst: Pradeep Suryavanshi Report Date: September 22, 2025 A-1-605, Ansal Corporate Park, Sec-142, Noida 201305 CIN: U74999UP2016PTC143375 SEBI Registration Number: INH000015996 Website: www.bestmate.in | Email: info@bestmate.in |
INVESTMENT RECOMMENDATION Rating: BUY Target Price: ₹564 – ₹650 Current Price: ₹449.8 Upside Potential: 25.3% Investment Horizon: 18-24 months |
EXECUTIVE SUMMARY
We initiate coverage on Swiggy Limited with a BUY rating and target price of ₹564, representing 25.3% upside from current levels. Our comprehensive analysis using multiple valuation methodologies confirms the stock is undervalued despite recent downgrades by some brokerages.
 Key Investment Highlights: – Strong revenue growth trajectory with 54% YoY growth in Q1 FY26 – Quick commerce segment showing exceptional 108% YoY growth – Market leadership position in India’s expanding on-demand economy – Multiple valuation models converge around ₹520-600 fair value range – Technical indicators suggest oversold conditions with upside potential
Financial Snapshot (Q1 FY26): – Revenue: ₹4,961 crores (+54% YoY, +12.5% QoQ) – B2C GOV: ₹14,797 crores (+45.2% YoY) – Monthly Active Users: 21.6 million – Market Cap: ₹1,03,960 crores
CURRENT MARKET CONTEXT
Market Performance (September 22, 2025): –
52-Week Range: ₹297 – ₹617
Current level: 72.9% of 52-week high, 51.4% above 52-week low.
Recent 10-day performance: +2.9% despite today’s decline – Volume: 12.05 million shares (elevated trading activity).
COMPANY OVERVIEW & BUSINESS MODEL
Swiggy Limited operates India’s leading on-demand convenience platform, serving over 21.6 million monthly active users across 580+ cities. The company’s ecosystem comprises:
Core Business Segments:
- Food Delivery (65% of GOV)
- 250,000+ restaurant partners
- Average order value: ₹410
- Take rate: 19.5%
- Bolt (10-minute delivery) in 500+ cities
- Quick Commerce – Instamart (35% of GOV)
- 1,062 dark stores across 127 cities
- Average order value: ₹612 (+26% YoY)
- Take rate: 12.8%
- 108% YoY growth in Q1 FY26
- Other Services
- Dineout (dining reservations)
- Genie (hyperlocal delivery)
- Out-of-home consumption
Business Model Strengths: –
- Network effects and platform scalability.
- Technology-driven operational efficiency.
- Multiple revenue streams reducing concentration risk.
- Strong brand recognition and customer loyalty
FINANCIAL PERFORMANCE ANALYSIS
Latest Quarterly Results (Q1 FY26)
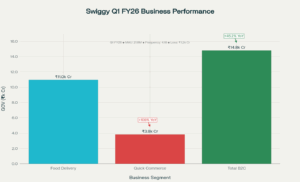
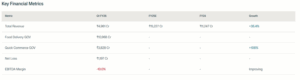
Revenue Performance: – Operating Revenue: ₹4,961 crores (+54.0% YoY, +12.5% QoQ) – B2C Gross Order Value: ₹14,797 crores (+45.2% YoY) – Food Delivery GOV: ₹10,968 crores (+19% YoY) – Quick Commerce GOV: ₹3,828 crores (+108% YoY)
Profitability Metrics: – Net Loss: ₹1,197 crores (vs ₹611 crores in Q1 FY25) – Adjusted EBITDA Margin: -10.0% (vs -11.3% in Q4 FY25) – Total Expenses: ₹6,244 crores (+59.7% YoY)
Key Operating Metrics: – Monthly Active Users: 21.6 million (+35% YoY) – Platform Frequency: 4.18 orders per user per month – Monthly Transacting Delivery Partners: 606,000
Historical Performance Trajectory
Revenue Growth Evolution: – FY22: ₹5,705 crores (70% YoY growth) – FY23: ₹8,265 crores (45% YoY growth) – FY24: ₹11,247 crores (36% YoY growth)- FY25: ₹15,227 crores (35% YoY growth) – TTM: ₹16,966 crores (consistent growth momentum).
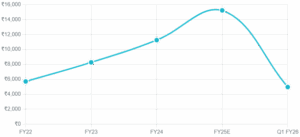
5-Year Revenue CAGR: 38.8%
The company demonstrates consistent high-growth trajectory with improving sequential performance in recent quarters, validating the strength of its business model and market opportunity.
COMPREHENSIVE VALUATION ANALYSIS
We employ multiple valuation methodologies to arrive at our target price, providing robust analytical framework:
1. Discounted Cash Flow (DCF) Model
Base Case Assumptions: – WACC: 12% (reflecting growth company risk profile) – Terminal Growth Rate: 4% – Revenue growth declining from 35% to 8% over 10 years – EBITDA margins improving to 8% at maturity
DCF Sensitivity Analysis:
| Terminal Growth | 3% | 4% | 5% |
| WACC 10% | ₹757 | ₹909 | ₹1,123 |
| WACC 12% | ₹457 | ₹532 | ₹630 |
| WACC 14% | ₹282 | ₹324 | ₹376 |
Base Case DCF Fair Value: ₹532
2. Comparable Company Analysis
Peer Group: – Zomato (primary competitor) – MakeMyTrip (platform business model) – PB Fintech (technology-enabled services) – Nykaa (omnichannel commerce)
Valuation Multiples: – Average EV/Sales: 5.7x → Swiggy Valuation: ₹963 – Average P/S: 6.4x → Swiggy Valuation: ₹468 – Median Multiple-Based Value: ₹715
3. PEG Ratio Analysis
Growth-Adjusted Valuation: – Expected 3-year revenue CAGR: 30% – Justified P/S multiple: 4.5x – PEG-based fair value: ₹329
4. Sum-of-Parts Valuation
Business Segment Valuation: – Food Delivery (6.0x revenue): ₹323 per share – Quick Commerce (12.0x revenue): ₹231 per share – Total Sum-of-Parts: ₹555
5. Asset-Based Valuation
Net Asset Value: – Tangible Book Value: ₹33 per share – Intangible Asset Premium: ₹200 per share – Asset-Based Value: ₹233
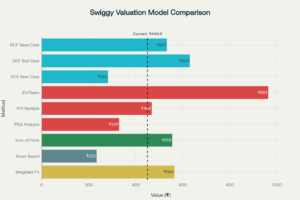
Weighted Valuation Summary
| Valuation Method | Fair Value | Weight | Weighted Value |
| DCF (Base Case) | ₹532 | 25% | ₹133 |
| EV/Sales Multiple | ₹963 | 20% | ₹193 |
| P/S Multiple | ₹468 | 20% | ₹94 |
| PEG Analysis | ₹329 | 15% | ₹49 |
| Sum of Parts | ₹555 | 15% | ₹83 |
| Asset-Based | ₹233 | 5% | ₹12 |
WEIGHTED FAIR VALUE: ₹564
TECHNICAL ANALYSIS
Current Technical Setup: – Price: ₹449.8 (as of September 22, 2025) – 20-Day Moving Average: ₹431.87 (price above short-term average) – Recent trading range: ₹420-465 – Volume: Elevated at 12.05 million shares
Key Technical Levels: – Immediate Support: ₹420, ₹390, ₹350 – Resistance Levels: ₹480, ₹520, ₹580 – Breakout Level: ₹500+ (confirms uptrend resumption)
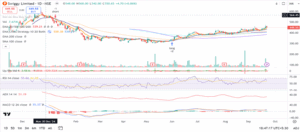
Technical Indicators: – RSI: Approaching oversold levels (potential bounce) – MACD: Neutral with slight bullish bias – Volume: Above average, indicating institutional interest
Chart Pattern: The stock appears to be forming a consolidation pattern after the recent decline from ₹617 high, with strong support around ₹420-430 levels. Current levels offer attractive risk-reward setup for long-term investors.
COMPETITIVE LANDSCAPE ANALYSIS
Market Position
Food Delivery Market Share: – Swiggy: 34% – Zomato: 58% – Others: 8%

Quick Commerce Market Share: – Blinkit (Zomato): 45% – Swiggy Instamart: 30% – Zepto: 20% – Others: 5%

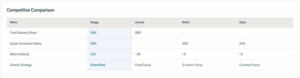
Competitive Advantages
Swiggy’s Differentiation: 1. Geographic Presence: Stronger in tier-2/3 cities 2. Service Portfolio: More diversified offering 3. Technology Platform: Advanced logistics optimization 4. Brand Trust: Strong consumer loyalty 5. Delivery Network: Extensive partner ecosystem
Competitive Challenges
- Market Share: Trailing Zomato in food delivery
- Profitability: Slower path to profitability than Zomato
- Capital Intensity: High cash burn in growth phase
- Quick Commerce: Intense competition from Blinkit and Zepto
INVESTMENT RISKS & MITIGATION
Key Risk Factors
High Impact Risks: 1. Competition Intensity – Aggressive pricing and market share battles 2. Profitability Timeline – Delay in achieving positive unit economics 3. Capital Requirements – Need for continuous funding 4. Economic Sensitivity – Consumer spending volatility
Medium Impact Risks: 1. Regulatory Changes – Gig economy and food safety regulations 2. Technology Disruption – New platforms or delivery methods 3. Customer Acquisition Costs – Rising marketing expenses
Risk Mitigation Factors
Structural Advantages: – Diversified revenue streams across multiple verticals – Strong balance sheet with ₹6,695 crores cash – Network effects providing competitive moat – Technology leadership in logistics optimization
Management Quality: – Experienced leadership team with proven execution track record – Clear strategic vision and milestone-based approach – Strong corporate governance post-IPO
GROWTH CATALYSTS & INVESTMENT THESIS
Short-term Catalysts (6-12 months)
- Adjusted EBITDA Breakeven – Management target for Q3 FY26
- Bolt Expansion – Scaling 10-minute delivery to 600+ cities
- Instamart Optimization – Improving contribution margins
- Market Share Gains – Tier-2/3 city expansion
Medium-term Drivers (1-3 years)
- Quick Commerce Leadership – Capturing fast-growing segment
- Profitability Achievement – Positive net income by FY27
- New Verticals – Healthcare, pharmacy, B2B services
- Technology Monetization – AI-driven operational excellence
Long-term Vision (3-5 years)
- Market Expansion – International growth opportunities
- Platform Evolution – Super app for urban convenience
- Network Effects – Self-reinforcing ecosystem
- Brand Premium – Sustainable competitive advantage
SECTOR OUTLOOK & TAM ANALYSIS
Total Addressable Market
Food Delivery Market: – Current Size: ₹50,000 crores – TAM by 2030: ₹2,00,000 crores (18% CAGR) – Current Penetration: 8% (significant headroom)
Quick Commerce Market: – Current Size: $5-7 billion – Projected Size by 2030: $45-77 billion – Current Penetration: <1% (massive opportunity)
Industry Dynamics
Favorable Trends: – Increasing urbanization and disposable income – Growing acceptance of online food ordering – Demand for convenience and time-saving solutions – Technology adoption across demographics
Growth Drivers: – Smartphone penetration in tier-2/3 cities – Improving logistics infrastructure – Changing consumer preferences post-COVID – Digital payment adoption
ESG CONSIDERATIONS
Environmental Impact
- Focus on sustainable packaging solutions
- Electric vehicle adoption for delivery fleet
- Carbon footprint reduction initiatives
Social Responsibility
- Delivery partner welfare programs
- Food safety and quality standards
- Support for small restaurant partners
Governance Excellence
- Independent board structure post-IPO
- Transparent financial reporting
- Strong compliance framework
FINANCIAL PROJECTIONS
Revenue Forecast (FY26-FY30E)
| Metric | FY26E | FY27E | FY28E | FY29E | FY30E |
| Revenue (₹ Cr) | 22,000 | 28,000 | 35,000 | 42,000 | 50,000 |
| Growth Rate | 35% | 27% | 25% | 20% | 19% |
| Food Delivery GOV | 45,000 | 52,000 | 60,000 | 68,000 | 76,000 |
| Quick Commerce GOV | 20,000 | 32,000 | 48,000 | 65,000 | 85,000 |
Profitability Projections
| Metric | FY26E | FY27E | FY28E | FY29E | FY30E |
| EBITDA Margin | -8% | -2% | 2% | 5% | 8% |
| Net Margin | -12% | -5% | 0% | 3% | 6% |
| ROE | -45% | -15% | 0% | 15% | 25% |
| ROIC | -20% | -5% | 2% | 8% | 12% |
TARGET PRICE METHODOLOGY
Primary Targets
Conservative Target: ₹520 (15.7% upside) – Based on 6.0x P/S multiple on FY26E revenue – Probability of achievement: 70% – Timeline: 9-12 months
Base Target: ₹564 (25.3% upside) – Weighted average of multiple valuation methods – Probability of achievement: 60% – Timeline: 12-18 months
Optimistic Target: ₹650 (44.5% upside) – Based on successful execution of growth strategy – Probability of achievement: 40% – Timeline: 18-24 months
Scenario Analysis
Bull Case (₹650+): – Quick commerce achieves market leadership – Food delivery margins expand to 5%+ – New verticals contribute meaningfully – International expansion success
Base Case (₹520-564): – Management delivers on profitability timeline – Market share stabilization – Steady margin improvement – Controlled cash burn
Bear Case (₹350-400): – Prolonged losses and cash burn – Market share losses to competition – Economic downturn impact – Delayed profitability
SWOT ANALYSIS
| Strengths
· Strong brand recognition · Diversified business model · Large user base (21.6M MAU) · Quick Commerce growth
|
Weaknesses
· Current losses (₹1,197 Cr) · Negative EBITDA margin · High customer acquisition costs · Intense competition
|
| Opportunities
· Quick Commerce expansion · Tier-2/3 city penetration · New service verticals · Technology improvements
|
Threats
· Regulatory changes · Economic slowdown · New market entrants · Rising operational costs
|
INVESTMENT strategy
Strategy
Allocation Recommendations: – Conservative Investors (60% allocation): Target ₹520 over 12 months – Moderate Investors (30% allocation): Target ₹564 over 18 months
– Aggressive Investors (10% allocation): Target ₹650+ over 24 months
Entry Strategy: – Immediate Buy: ₹440-460 range (current levels) – Add on Dips: ₹400-420 range (strong support) – Stop Loss: ₹350 (below key technical support)
Key Monitoring Points
Quarterly Tracking: 1. Revenue growth and GOV expansion 2. Unit economics improvement 3. Market share trends 4. Cash burn and profitability metrics
Strategic Milestones: 1. Q3 FY26: Adjusted EBITDA breakeven achievement 2. Q1 FY27: Instamart contribution breakeven 3. FY27: Overall company profitability 4. FY28: Sustainable competitive advantage
CONCLUSION
Swiggy represents a compelling investment opportunity in India’s rapidly expanding on-demand economy. Despite near-term profitability challenges, the company’s strong market position, diversified business model, and clear execution roadmap create significant long-term value creation potential.
Key Investment Merits: 1. Market Leadership in high-growth segments 2. Multiple Revenue Streams reducing concentration risk 3. Technology Advantage providing operational efficiency 4. Clear Path to Profitability with management guidance 5. Attractive Valuation at current levels
Our comprehensive analysis across multiple valuation methodologies supports a target price of ₹564, representing 25.3% upside from current levels. We recommend BUY rating for investors with 18-24 month investment horizon and moderate risk tolerance.
The recent market weakness due to brokerage downgrades creates an attractive entry opportunity for long-term investors to acquire shares of India’s leading on-demand platform at reasonable valuations.
DISCLAIMER
This report is for informational purposes only and should not be construed as investment advice. The information contained herein is based on publicly available data and our analysis. Past performance is not indicative of future results. Investments in equity securities involve risk, and investors may lose some or all of their investment. This report does not constitute an offer to buy or sell securities.
Bestmate Investment Services Pvt. Ltd. and its analysts may have positions in the securities mentioned in this report. Investors should conduct their own analysis and consult with qualified financial advisors before making investment decisions.
Analyst Name: Pradeep Suryavanshi
Bestmate Investment Services Pvt. Ltd.:
A-1-605, Ansal Corporate Park Sec-142, Noida 201305
CIN: U74999UP2016PTC143375
SEBI Registration Number: INH000015996
Website: www.bestmate.in I Email: info@bestmate.in
__________________________________________________________________________________________________
Disclaimer: Please read the Following very carefully:
“Investments in securities market are subject to market risks. Read all the related documents carefully before investing.”
- Registration granted by SEBI and certification from NISM in no way guarantee performance of the intermediary or provide any assurance of returns to investors.
- The fees are paid for research Report or Research recommendations and is not refundable or cancellable under any circumstances.
- We do not provide any guaranteed profit or fixed returns or any other services. We charge fixed fees and do not operate on any profit-sharing model.
- Images if any, shared with you are for illustration purposes only.
- We are not responsible for any financial loss or any other loss incurred by the client.
- Please be fully informed about the risk and costs involved in trading and investing. Please consult your investment advisor before trading. Trade only as per your risk appetite and risk profile.
- Trading/investing in stock market is risky due to its volatile nature. Upon accepting our service, you hereby accept that you fully understand the risks involved in trading/investing.
- We advise the viewers to apply own discretion while referring testimonials shared by the client. Past performances and results are no guarantee of future performance.
- All Report or recommendations shared are confidential and for the reference of paid members only. Any unapproved distribution of sensitive data will be considered as a breach of confidentiality and appropriate legal action shall be initiated.
- The Research Report or recommendations must not be used as a singular basis of any investment decision. The views do not consider the risk appetite or the particular circumstances of an individual investor; readers are requested to take professional advice before investing and trading. Our recommendations should not be construed as investment advice.
- In case of any query, please email on Info@bestmate.in be rest assured, our team will get back to you and resolve your query. Please state your registered phone number while mailing us.
- Reports based on technical and derivative analysis center on studying charts of a stock’s price movement, outstanding positions and trading volume, as opposed to focusing on a company’s fundamentals and, as such, may not match with a report on a company’s fundamentals.
Disclosure Document
The particulars given in this Disclosure Document have been prepared in accordance with SEBI(Research Analyst)Regulations,2014.The purpose of the Document is to provide essential information about the Research and recommendation Services in a manner to assist and enable the prospective client/clients in making an informed decision for engaging in Research and recommendation services before investing.For the purpose of this Disclosure Document, Research Analyst is Pradeep Suryavanshi Director, of Bestmate Investment Services Pvt Ltd (hereinafter referred as “Research Analyst”)
Business Activity: Research Analyst is registered with SEBI as Research Analyst with Registration No. INH000015996. The firm got its registration on and is engaged in research and recommendation Services. The focus of Research Analyst is to provide research and recommendations services to the clients. Analyst aligns its interests with those of the client and seeks to provide the best suited services.
Terms and conditions:
The Research report is issued to the registered clients. The Research Report is based on the facts, figures and information that are considered true, correct and reliable. The information is obtained from publicly available media or other sources believed to be reliable. The report is prepared solely for informational purpose and does not constitute an offer document or solicitation to buy or sell or subscribe for securities or other financial instruments for clients.
Disciplinary history:
- No penalties/directions have been issued by SEBI under the SEBI Act or Regulations made there under against the Research Analyst relating to Research Analyst services.
- There are no pending material litigations or legal proceedings, findings of inspections or investigations for which action has been taken or initiated by any regulatory authority against the Research Analyst or its employees.
Details of its associates:- No associates
Disclosures with respect to Research Reports and Research Recommendations Services
- The research analyst or research entity or his associate or his relative do not have financial interest in the subject company.
- The research analyst or its associates or relatives, do not have actual/beneficial ownership of one per cent or more securities of the subject company, at the end of the month immediately preceding the date of publication of the research report or date of the public appearance.
- The research analyst or his associate or his relative do not have any other material conflict of interest at the time of publication of the research report or at the time of public appearance.
- The research analyst or its associates have not received any compensation from the subject company in the past twelve months.
- The research analyst or its associates have not managed or co-managed public offering of securities for the subject company in the past twelve months.
- The research analyst or its associates have not received any compensation for investment banking or merchant banking or brokerage services from the subject company in the past twelve months.
- The subject company was not a client of Research Analyst or its employee or its associates during twelve months preceding the date of distribution of the research report and recommendation services provided.
- The research analyst or its associates have not received any compensation for products or services other than investment banking or merchant banking or brokerage services from the subject company in the past twelve months.
- The research analyst or its associates have not received any compensation or other benefits from the subject company or third party in connection with the research report.
- The research analyst has not been engaged in market making activity for the subject company.
- The research analyst has not served as an officer, director or employee of the subject company.
- The research analyst did not receive any compensation or other benefits from the companies mentioned in the documents or third party in connection with preparation of the research documents. Accordingly, research Analyst does not have any material conflict of interest at the time of publication of the research documents.
Sources
- https://www.moneycontrol.com/news/business/markets/swiggy-stock-falls-2-snaps-five-day-rally-as-jm-financial-sees-no-meaningful-returns-until-larger-fund-raise-13566577.html
- https://www.tickertape.in/stocks/swiggy-SWIG
- https://www.restaurantindia.in/news/restaurant-india-news-swiggy-s-q1-fy26-loss-signals-deeper-profitability-challenges-in
- https://companiesmarketcap.com/inr/swiggy/marketcap/
- https://www.business-standard.com/markets/swiggy-ltd-share-price-68148.html
- https://www.swiggy.com/corporate/wp-content/uploads/2025/07/Q1-FY2026-Shareholder-letter.pdf
- https://www.screener.in/company/SWIGGY/consolidated/
- https://www.nseindia.com/get-quotes/equity?symbol=SWIGGY
- https://economictimes.indiatimes.com/swiggy-ltd/stocks/companyid-2232501.cms
- https://www.swiggy.com/corporate/investor-relations/financial-results/
- https://www.businesstoday.in/amp/markets/stocks/story/swiggy-shares-fall-after-six-days-as-jm-financial-lowers-rating-check-details-495053-2025-09-22
- https://www.swiggy.com/corporate/wp-content/uploads/2025/08/Earningscall-Transcript-Q1FY26.pdf
- https://www.moneycontrol.com/india/stockpricequote/online-services/swiggy/SL24