
Analyst Name: Pradeep Suryavanshi (Founder Director)
Bestmate Investment Services Pvt. Ltd.:
A-1-605, Ansal Corporate Park Sec-142, Noida 201305
CIN: U74999UP2016PTC143375
SEBI Registration Number: IN000015996
Date :- 21-07-2025 I Price Range – 3400-3500 I View – Bullish I Targets – 1 Year – ~20%(~₹4500), 2 Year – ~30%(~₹5650) , 3 Year – ~50%(~₹6700) I Download Full Report – LT 21-07-2025
Download AI generated Hindi Voice Summary :-
Investment Thesis & Summary
Larsen & Toubro (L&T) is India’s leading engineering and infrastructure conglomerate, poised to benefit enormously from the country’s infrastructure boom and industrial growth. The company has delivered robust financial performance in FY2025 – with revenues crossing ₹2.55 lakh crore (16% YoY growth) and record order inflows of ₹3.56 lakh crore (18% YoY). Its order book stands at an all-time high of ₹5.79 lakh crore (as of Mar 31, 2025), up 22% YoY, providing multi-year revenue visibility. We expect L&T to leverage this strong backlog and India’s rapid infrastructure development (supported by government capex and private investment) to sustain ~15% annual growth in the coming years.
Our valuation analysis (DCF and sum-of-parts) indicates that L&T’s stock is undervalued relative to its growth prospects. At a current market price (CMP) of ~₹3,770, the stock trades at ~31× trailing P/E, which is reasonable given expected earnings CAGR >15% and improving return on equity (ROE). We set a 1-year target price of ~₹4,500 (about 20% upside) and foresee ~50% upside (to ~₹5,650) over 3 years from the CMP, implying healthy compounding. Key drivers include a 15%+ revenue growth guidance for FY2026 (management guides ~15% growth), margin expansion, and potential re-rating as L&T’s portfolio becomes more technology and asset-light. The company’s strong balance sheet (net debt/EBITDA ~0.5×) and diversified business mix add to our conviction. Overall, L&T offers a unique play on India’s growth story, combining core infrastructure exposure with high-margin IT and manufacturing subsidiaries, and we maintain a bullish outlook on the stock over 1–3 years.
(Note: All financial figures are in Indian Rupees; ₹1 lakh crore = ₹1 trillion = 100,000 crores.)
Company Overview & Segment Diversification
Founded in 1938 by Henning Holck-Larsen and S.K. Toubro, L&T has evolved into a powerhouse spanning multiple sectors. Today, it operates through several business segments: Infrastructure Projects, Energy (Hydrocarbon & Power), Hi-Tech Manufacturing (including Defence Engineering), IT & Technology Services, Financial Services, Development Projects, and Others. This diversified structure gives L&T a broad revenue base and resilience across economic cycles. Below is a snapshot of L&T’s key segments and their focus areas:
- Infrastructure Projects (EPC) – Engineering & construction of buildings, factories, transportation infrastructure, heavy civil projects, power transmission & distribution, water and renewable energy projects. This is L&T’s largest segment, contributing over half of consolidated revenues. It includes landmark projects like metros, highways, airports, and smart cities.
- Energy Projects (Hydrocarbon & Power) – Provides end-to-end solutions for the oil & gas industry (onshore and offshore EPC) and builds thermal power plants and related equipment. L&T’s Hydrocarbon business serves global clients in upstream, midstream and downstream projects, while the Power segment handles boilers, turbines, etc., for power generation.
- Hi-Tech Manufacturing & Defence Engineering – Manufactures specialized, custom-designed critical equipment for sectors like refineries, petrochemicals, fertilizers, nuclear and aerospace, and includes L&T’s defence arm which designs and makes defense equipment (e.g. artillery, naval vessels). This segment represents L&T’s foray into high-value manufacturing and defense indigenization.
- IT & Technology Services – Comprises the software and technology services subsidiaries LTIMindtree (IT services & digital solutions) and L&T Technology Services (LTTS) (engineering R&D services). These units contribute high-margin, asset-light revenues globally (primarily from North America and Europe).
- Financial Services – Represented by L&T Finance Ltd (NBFC arm) which offers retail and wholesale loans, asset management (until recently), and other financial products. L&T is refocusing this business on retail lending (farm equipment, two-wheelers, micro-loans, etc.) for stability.
- Development Projects – Includes infrastructure development and concessions: e.g. L&T’s Hyderabad Metro Rail project, power development projects, and previously, toll road projects (many road assets have been divested). This segment also houses new initiatives in areas like green hydrogen and data centers.
- Others – Covers smaller businesses such as realty, smart world & communication (tech integration for cities), construction & mining machinery (distribution and servicing), and industrial machinery. These are ancillary but strategically important verticals.
Such a wide-ranging portfolio makes L&T a proxy for India’s overall infrastructure and economic development. Few companies match L&T’s depth and breadth – from constructing mega infrastructure to writing software code – which provides multiple growth levers. In recent years, management has also undertaken strategic consolidation (e.g. merging LTI and Mindtree to form LTIMindtree) and exiting non-core businesses to sharpen focus. For instance, L&T divested its electrical & automation division to Schneider in 2020 and is exploring monetization of certain projects. This ability to pivot and reinvent has kept L&T at the forefront of India’s industrial evolution for decades.
Strong Order Book and India Growth Linkage
One of L&T’s greatest strengths is its stellar order backlog, which anchors future growth. As of March 31, 2025, L&T’s consolidated order book stood at ₹5.79 lakh crore (₹5.79 trillion), a 22% YoY jump and the highest ever. This was driven by record order inflows of ₹3.56 lakh crore in FY2024-25, despite global macro headwinds. Notably, international orders now contribute ~46% of the order book, reflecting L&T’s expanding global footprint in the Middle East, Africa, and beyond. In Q4 FY25 alone, L&T won ₹89,613 crore of new orders (70% from overseas), including an “ultra-mega” offshore gas project from Qatar Energy that boosted the hydrocarbon backlog.
This robust order book gives strong revenue visibility – equivalent to ~2.3× FY25 revenues. Moreover, the prospective tender pipeline for FY26 is huge at ₹19 lakh crore, a 57% increase YoY. According to the company, infrastructure projects account for ₹9.6 trillion of this pipeline (vs ₹7.3 trillion a year ago), led by areas like heavy civil works, transportation, renewables, power T&D, buildings/factories, water and urban infra. Such data points underscore that L&T’s addressable opportunity is expanding, not just domestically but also internationally.
India’s growth story is intricately linked to L&T’s prospects. The Indian government has aggressively ramped up infrastructure spending – for instance, the Union Budget FY2023-24 set a record capital expenditure outlay of ₹10 lakh crore (a 37% jump over the previous year), and this momentum continues. For FY2024-25, capex is budgeted even higher (₹11.1 lakh crore), aiming to modernize railways, roads, ports, housing, and more. L&T, being the nation’s largest infrastructure builder, is a prime beneficiary of these investments. As the CFO of Siemens India observed, the government’s push for “building world-class infrastructure” and manufacturing will directly benefit companies like L&T engaged in construction and capital goods.
Key initiatives driving order inflows include the National Infrastructure Pipeline (NIP), industrial corridor projects, metro/rail network expansions, renewable energy parks, and defense procurement (where L&T’s defense arm is participating in Make-in-India programs). In the Middle East, high oil prices have led to renewed capex on oil & gas and urban infrastructure, which L&T has tapped into (e.g. large projects in Saudi, UAE, Qatar). L&T’s management remains “cautiously optimistic” on order prospects, citing strong pipelines both in India and abroad.
Importantly, L&T is selective in taking orders to ensure profitability. The company has acknowledged that the rising share of international orders (which are often fixed-price contracts) can be margin dilutive, but they mitigate this through cost controls and consortium partnerships on mega-projects. The current backlog has a healthy mix of public and private sector orders, and execution timelines spread over 2–5 years, smoothing revenue recognition.
In summary, L&T’s record order book – coupled with a pro-investment economic environment in India – lays a solid foundation for sustained growth. We expect order inflows to grow ~10% annually (management’s guidance for FY26 is >10% growth in order flow), which should keep the order book at ~2x revenue cover. This visibility, in turn, underpins our revenue and earnings projections for the next 3–5 years.
Financial Performance & Balance Sheet Health
L&T’s financial performance in recent years has been strong and improving. FY2024-25 (FY25) was a standout year, with consolidated revenues of ₹255,734 crore (₹2.557 trillion), rising 16% year-on-year. Net profit (after tax and minority interest) was ₹17,687 crore in FY25, up ~14% YoY. This profit includes contributions from all subsidiaries; the net profit attributable to L&T’s shareholders was ₹15,037 crore (up 15% YoY) after accounting for minority interests in IT and finance units. L&T has thus grown its top line and bottom line at a healthy pace, reflecting strong execution of its large order book and improved operational efficiencies.
Profit & Loss
Consolidated Figures in Rs. Crores :-
| Mar-20 | Mar-21 | Mar-22 | Mar-23 | Mar-24 | Mar-25 | |
| Sales + | 1,45,452 | 1,35,979 | 1,56,521 | 1,83,341 | 2,21,113 | 2,55,734 |
| Expenses + | 1,20,899 | 1,12,519 | 1,32,207 | 1,56,175 | 1,92,355 | 2,21,399 |
| Operating Profit | 24,553 | 23,460 | 24,314 | 27,166 | 28,758 | 34,335 |
| OPM % | 17% | 17% | 16% | 15% | 13% | 13% |
| Other Income + | 3,015 | 8,111 | 2,364 | 2,891 | 4,953 | 3,289 |
| Interest | 11,021 | 11,750 | 9,235 | 9,445 | 9,512 | 9,925 |
| Depreciation | 2,462 | 2,904 | 2,948 | 3,502 | 3,682 | 4,121 |
| Profit before tax | 14,086 | 16,918 | 14,495 | 17,109 | 20,517 | 23,579 |
| Tax % | 23% | 24% | 29% | 26% | 24% | 25% |
| Net Profit + | 10,894 | 12,921 | 10,419 | 12,531 | 15,547 | 17,673 |
| EPS in Rs | 68.02 | 82.47 | 61.7 | 74.5 | 95 | 109.35 |
| Dividend Payout % | 26% | 44% | 36% | 32% | 36% | 31% |
***Source :- www.screener.in
Notably, L&T’s profitability metrics have seen an uptick. The consolidated EBITDA margin expanded slightly in FY25, and the core Infrastructure segment EBITDA margin improved to 6.4% (from 6.2% a year ago) on better cost execution. Company-wide operating margin (EBITDA as % of sales) stood around 11% in Q4 FY25. While fixed-price overseas orders put some pressure on margins in hydrocarbon projects, L&T expects core E&C EBITDA margin to reach ~8.5% in FY26 (vs 8.3% in FY25) with stable commodity prices. This margin guidance indicates management’s focus on profitability, not just revenue growth. The return on equity (ROE) has also improved to ~16.6% in FY25, up from ~10% in FY21, thanks to higher profits and efficient capital use. In fact, under its strategic plan, L&T aims for >18% ROE by FY26, which seems achievable given current trajectory.
L&T’s balance sheet is solid for a company of its scale. The company maintains moderate leverage and ample liquidity. As of FY25, net debt-to-EBITDA is only ~0.5× (Fitch Ratings also affirmed L&T’s rating at BBB+ with stable outlook, citing “stable profitability” and low leverage). Gross borrowings on the consolidated books are higher (₹1.32 lakh crore as of Mar 2024), but a large portion of this is in L&T’s financial services arm (L&T Finance), which is supported by its lending portfolio. Excluding the NBFC, L&T’s core engineering business has a conservative debt profile and substantial cash reserves. The working capital management has improved significantly, with net working capital as a percentage of sales at multi-year lows. The company’s working capital days reduced from ~38 days to just 19 days, reflecting better receivable collections and project cash flows. This is an important achievement, as historically EPC companies suffer from elongated receivables – L&T has brought this under control, boosting operating cash flow.
Balance Sheet :-
| Mar-20 | Mar-21 | Mar-22 | Mar-23 | Mar-24 | Mar-25 | |
| Equity Capital | 281 | 281 | 281 | 281 | 275 | 275 |
| Reserves | 51,895 | 61,457 | 66,833 | 71,247 | 64,241 | 71,621 |
| Borrowings + | 25,942 | 24,664 | 20,477 | 18,339 | 22,812 | 22,295 |
| Other Liabilities + | 63,439 | 73,513 | 80,912 | 82,558 | 88,436 | 92,225 |
| Total Liabilities | 1,41,557 | 1,59,916 | 1,68,502 | 1,72,424 | 1,75,764 | 1,86,416 |
| Fixed Assets + | 7,840 | 9,165 | 9,113 | 9,756 | 11,119 | 11,254 |
| CWIP | 797 | 287 | 583 | 1,955 | 1,424 | 1,139 |
| Investments | 34,034 | 49,414 | 45,528 | 47,261 | 47,463 | 57,642 |
| Other Assets + | 98,885 | 1,01,050 | 1,13,279 | 1,13,452 | 1,15,759 | 1,16,381 |
| Total Assets | 1,41,557 | 1,59,916 | 1,68,502 | 1,72,424 | 1,75,764 | 1,86,416 |
***Source :- www.screener.in
Cash flows have accordingly been strong. L&T generated over ₹29,000 crore in cash from operations in FY25 (before working capital changes) as per company disclosures, which comfortably covered its capex and dividend payouts. The dividend track record is consistent – the Board recommended a dividend of ₹34 per share for FY25, translating to a ~1% dividend yield at CMP and a payout ratio of ~33%. This signals confidence in cash generation.
Cash Flow :-
| Mar-20 | Mar-21 | Mar-22 | Mar-23 | Mar-24 | Mar-25 | |
| Cash from Operating Activity + | -121 | 9,561 | 5,999 | 7,264 | 8,297 | 12,724 |
| Cash from Investing Activity + | -6,834 | -2,780 | 4,555 | -1,738 | 6,362 | -6,356 |
| Cash from Financing Activity + | 7,419 | -6,698 | -8,360 | -7,441 | -14,522 | -6,725 |
| Net Cash Flow | 464 | 82 | 2,193 | -1,916 | 137 | -357 |
***Source :- www.screener.in
Financial gearing is prudent: consolidated debt/equity is around 1.5×, but again, much of the debt is in the financing business (which is backed by loan assets). The core business debt/equity is modest (~0.3× by our estimates). L&T also periodically monetizes assets (for example, selling developmental projects to infrastructure investment trusts or strategic buyers) to recycle capital and keep debt in check.
Ratios :-
| Mar-20 | Mar-21 | Mar-22 | Mar-23 | Mar-24 | Mar-25 | |
| Debtor Days | 124 | 139 | 131 | 110 | 107 | 98 |
| Inventory Days | 29 | 29 | 26 | 25 | 23 | 20 |
| Days Payable | 383 | 405 | 384 | 309 | 265 | 224 |
| Cash Conversion Cycle | -230 | -237 | -226 | -174 | -135 | -106 |
| Working Capital Days | 86 | 63 | 42 | 36 | 43 | 31 |
| ROCE % | 13% | 12% | 13% | 14% | 15% | 19% |
***Source :- www.screener.in
Bottom line: L&T’s financial health is robust, with growing revenues, improving margins, and manageable leverage. The company is balancing growth with profitability. Its large size and cash flows also give it the ability to invest in new opportunities (e.g., green energy, technology ventures) without straining the balance sheet. Investors can take comfort in L&T’s financial stability and discipline, which lowers the risk profile compared to many other players in the construction/infra space.
Segment Analysis: Performance and Outlook
- Infrastructure Projects (E&C): This is L&T’s flagship segment, accounting for the largest share of revenue and orders. In FY25, the Infrastructure segment secured ₹1,73,226 crore of new orders (+21% YoY), underpinning its dominant backlog. The order book for infra stood at ₹3,57,053 crore as of Mar 2025 (39% international). Execution picked up pace, with the segment delivering customer revenues of ₹1,29,897 crore in FY25, a 15% YoY growth. This was achieved despite a high base and some execution challenges (Q4 infra revenue growth was a subdued 2% YoY due to front-loaded execution in earlier quarters). Importantly, infra margins improved – FY25 EBITDA margin in this segment was 6.4%, up from 6.2% last year, aided by cost savings and better project mix. Infrastructure projects tend to be lower margin but high volume; L&T’s focus is on automation and digital tools to squeeze out extra efficiency (e.g., using drones for site surveys, modular constructions, etc.).
Outlook for Infra: Very positive. With government capex in transport (roads, rail, metros), urban infrastructure, water and renewables at all-time highs, L&T’s pipeline here is strong. In FY26, the domestic infra tender pipeline is over ₹9 trillion, including high-speed rail, new metro lines (e.g., Chennai, Bengaluru expansions), river-linking projects, and data center parks. L&T, with its execution track record, is often the frontrunner for such mega-projects. The company did carve out a separate Renewable Energy vertical within the Power T&D business – indicating a strategic push in solar, wind, and energy storage EPC projects. We anticipate infra segment revenue to grow in mid-teens annually, with gradual margin improvement to ~7-8% as operating leverage kicks in. The key monitorables are timely execution and managing input costs (cement, steel), but L&T’s scale gives it bargaining power on procurement.
- Energy Projects (Hydrocarbon & Power): This segment has been a stellar performer recently, driven by resurgent hydrocarbon orders. In FY25, Energy segment order inflows were ₹87,569 crore (+19% YoY), and the order book reached ₹1,65,754 crore (a hefty 73% of which is international). The big boost came from the Hydrocarbon sub-segment: for the second year in a row, L&T won strong orders in oil & gas, including the huge offshore project in Qatar (Q4 FY25 Energy orders jumped >100% YoY). On the revenue side, the segment achieved ₹40,668 crore in FY25 revenues, a 38% YoY growth – the fastest among L&T’s segments. This reflects execution ramp-up on large petrochemical and refinery jobs in the Middle East and some recovery in the domestic power business. Margins in Energy came in at 8.4% for FY25, which is lower than 10.0% in the previous year due to many projects being in early stages (where revenue is booked but margin is yet to catch up as milestones progress). Management expects margin to normalize as these projects mature.
Outlook: We remain bullish on Hydrocarbon orders – Middle East national oil companies are investing in capacity (Abu Dhabi’s ADNOC, Saudi Aramco, etc.), and L&T with its international reputation in modular refinery projects stands to benefit. The company splitting Hydrocarbon into Offshore and Onshore verticals from April 2025 indicates the scale of this business now. Additionally, L&T’s emphasis on “Carbon Lite Solutions” – likely services focused on cleaner fuels, carbon capture, hydrogen – fetched its highest-ever order inflow in that segment in FY25, which bodes well as energy companies worldwide pivot to green projects. On the Power front, while new thermal power CAPEX is limited, L&T is focusing on flue gas desulfurization (FGD) retrofits and perhaps nuclear power equipment (it has capabilities via L&T Heavy Engineering). We forecast energy segment revenue growth ~15-20% in FY26, moderating slightly thereafter, with margins recovering to ~9-10%. The international mix (60-70% of new orders) means execution risk (far-flung projects) but also diversified opportunities.
- Hi-Tech Manufacturing & Defence: This segment encapsulates L&T’s heavy engineering, defense, aerospace, and smart manufacturing businesses. FY25 saw ₹18,282 crore of orders won in this segment (+28% YoY), including key orders in Precision Engineering (which likely serves space/aircraft needs) and Heavy Engineering (e.g., reactors, pressurizers for nuclear plants). Exports formed 21% of these orders, indicating L&T’s engineering products have global takers. The Hi-Tech segment’s order book was ₹40,388 crore at FY25-end – smaller than infra or hydrocarbon but high-margin. Revenue for FY25 was ₹9,695 crore, up 18% YoY, and EBITDA margin rose to 17.3% (vs 16.3% prior year). The margin boost came from a better job mix and operating leverage. This is L&T’s highest-margin segment, reflecting the specialized nature of its offerings (for example, delivering equipment for ISRO or components for nuclear submarines commands good pricing).
Outlook: L&T’s defence engineering sub-segment is poised for growth as India’s defense procurement shifts towards indigenous sources. L&T is involved in defense shipbuilding (it built offshore patrol vessels and parts of submarines for the Indian Navy) and artillery systems (it manufactures the K9 Vajra howitzer under license) – these areas have ongoing procurement programs. The government’s push to involve the private sector in defense (e.g., strategic partner models for submarines, fighter jets) could open game-changing opportunities for L&T, given its excellent track record (it’s already delivering the Vishal-class submarines’ hull sections and won an order for modular bridges for the Army). In Heavy Engineering, the commissioning of new reactors (India’s nuclear program) and refinery upcycles globally can keep order books healthy. L&T also acquired the remaining 26% stake in L&T Special Steels & Heavy Forgings (making it a wholly-owned unit), which indicates confidence in the prospects of supplying heavy forgings (used in nuclear and hydrocarbon industries). We expect this segment to grow moderately (~10-15% annually) but maintain high margins ~17-18%. It’s a niche but strategic part of L&T’s portfolio, potentially housing some cutting-edge tech (note: L&T has also forayed into manufacturing electrolyzers for green hydrogen, a future opportunity).
- IT & Technology Services: L&T’s tech services arms – LTIMindtree (LTIM) and L&T Technology Services (LTTS) – are significant value drivers. Together, the IT & Technology Services segment generated ₹47,845 crore revenue in FY25, about 19% of L&T’s total revenues. Growth was a modest 8% YoY, reflecting the global IT spending slowdown (especially in BFSI and hi-tech clients) in late 2024. International business constitutes over 90% of this segment’s revenue. The segment EBITDA margin was ~19.5%, slightly down from 20.4% in previous year due to wage inflation and lower billings in some projects. Within this, LTIM (the merged entity of L&T Infotech and Mindtree) had FY25 revenue of ₹38,706 crore and PAT ~₹4,722 crore, while LTTS had revenue ₹7,194 crore and PAT ~₹1,266 crore (PAT figures from screener). These subsidiaries are listed entities in their own right and have market capitalizations of ~₹1.55 lakh crore (LTIM) and ~₹46,000 crore (LTTS) as of July 2025 – indicating the significant value they contribute to L&T’s sum-of-parts.
Outlook: The tech segment is expected to rebound as global IT demand picks up. Notably, L&T’s management sees technology as a growth pivot – it launched Lakshya 2026 strategic plan aiming to double revenue and order inflow by FY26 partly by expanding IT/TS business share. The goal is for L&T to evolve into more of a “technology solutions provider” and increase the IT/TS contribution from ~30% of market cap to ~40-45%. Concretely, LTIMindtree and LTTS are targeting double-digit revenue growth in FY26 (LTTS has guided double-digit growth for FY26). The medium-term outlook for these subs is strong – digital transformation, cloud, AI, and engineering R&D are secular growth areas. L&T has also made tuck-in acquisitions to bolster this segment: e.g., LTTS acquired a Silicon Valley-based SWC company, and L&T corporate acquired a 100% stake in SiliConch (semiconductor design startup) to boost L&T’s semiconductor design capabilities. These show L&T’s intent to stay at the cutting edge of tech. We expect IT & TS segment to accelerate to low-teens growth, and given their high margin (~20%), this will lift L&T’s consolidated margins and ROE. Importantly, these listed arms also provide financial flexibility – L&T could monetize small stakes if ever needed to fund new ventures (though currently, L&T retains ~68% in LTIM and ~74% in LTTS, indicating it values control).
- Financial Services (L&T Finance): L&T’s finance business has undergone a transformation. FY25 income from operations was ₹15,194 crore, up 16% YoY, and consolidated PAT hit an all-time high of ₹2,644 crore (~14% YoY growth). The big story is the pivot to retail lending. The total loan book reached ₹97,762 crore (Mar 2025), growing 14% YoY, and crucially retail loans now form 97% of the portfolio (up from ~50% a few years ago). L&T Finance has been shedding its wholesale and infrastructure loans and focusing on areas like two-wheeler loans, microfinance, consumer loans, and farm equipment loans. This has led to better asset quality and lower NPAs. In fact, 7 out of 14 business lines in L&T Finance now have zero NPAs as per company commentary, thanks to this retailization drive. The company also changed its name from “L&T Finance Holdings” to L&T Finance Ltd in 2023, reflecting a cleaned-up structure (it sold off the mutual fund business to HSBC in 2022, for instance).
Outlook: While NBFCs face intense competition and regulatory oversight, L&T Finance is relatively well-placed. It has a strong parentage and credit rating (helping borrowing costs) and is growing in under-penetrated rural/sub-urban markets. Disbursements in FY25 were healthy and the interest margin is stable ~8-9%. We anticipate 15-20% loan book CAGR and steady profits from this segment. From L&T’s perspective, the strategic question is whether to continue owning the finance business long-term. There have been market rumors in the past about a potential sale or merger of L&T Finance to a bank, to allow L&T to focus purely on EPC and tech. However, nothing concrete yet – and for now L&T Finance remains an integral part of the group, contributing ~8-10% of consolidated PAT. Its market cap is ~₹50,000 crore and L&T owns 66%, so it’s another valuable asset. We will watch if L&T considers unlocking value here in the future.
- Development Projects & Others: This segment is relatively smaller and includes project developments that L&T undertakes (often to catalyze business or later monetize). Development Projects revenue was ₹5,371 crore in FY25, a 4% decline YoY – the dip is because FY24 had a higher revenue base (possibly from a one-time arbitration claim or a divested project). L&T’s major development project is the Hyderabad Metro Rail, which is operational but has faced losses initially (like most metro projects, it will take years to break even). L&T is exploring restructuring or some support from the government for this project. Other pieces here include Nabha Power (a 2×700 MW thermal plant in Punjab) and an emerging green hydrogen project. L&T has announced investment of ₹1,000 crore in a green hydrogen plant as part of its development projects. The segment also included road concessions which have been largely sold off by now (the last few toll roads were divested to an InvIT in recent years). The “Others” segment (which sometimes is clubbed with Development Projects in reporting) had about ₹7,000 crore revenue in FY25, including L&T’s Realty business (which builds a few residential/commercial projects), Smart World & Communication (e.g., city surveillance projects, data centers), and industrial machinery units (like making rubber processing machines, etc.). These are non-core and either being scaled down or grown opportunistically.
Outlook: We expect minimal growth in Development Projects as L&T is not keen to take on new long-gestation concessions on its books. In fact, any positive surprise could come from monetization – e.g., if the Hyderabad Metro’s stake is reduced or restructured, it could unlock capital. The “Others” businesses like Realty might see some uptick (L&T has a few ongoing realty projects in Chennai, Mumbai), but in the big picture they’re <3% of revenues. The focus is likely to be on asset-light growth here: for instance, L&T is building large data center parks through partnerships and may not hold them long-term on its balance sheet. The company has also shown interest in Semiconductor fabrication/packaging – it formed L&T Semiconductor Technology Ltd and acquired a startup in chip design. If the Indian semiconductor mission progresses (with government subsidies), L&T could partner to set up a fab plant or packaging unit, which would probably sit in this segment initially. These ventures are in nascent stages but represent option value for the future.
Overall, L&T’s multi-segment structure means growth is well-distributed. In FY25, Infrastructure (incl. heavy civil) was ~51% of revenues, Energy ~16%, IT & Tech ~19%, Financial ~6%, and others ~8%. We see Infrastructure and Energy continuing to lead growth (on the back of public capex and petro-dollar projects), with IT contributing steady high-margin growth, and Finance adding stability. The portfolio mix is gradually shifting – for instance, management expects the core EPC proportion to decline a bit and IT/tech to rise as part of the overall pie by FY26 – which should help improve the blended margin and ROE.
Peer Comparison
L&T is often compared to other engineering and capital goods companies, but in truth, L&T is in a league of its own in India due to its size and range. Nonetheless, it’s useful to see how it stacks up against some peers:
- BHEL (Bharat Heavy Electricals Ltd): BHEL is a PSU that makes power plant equipment (boilers, turbines) and does EPC for power and some industrial projects. It’s one of the closest analogs in terms of taking large projects, but BHEL is much narrower in scope (mostly thermal power and some defense electronics). In FY2024-25, BHEL’s revenue was about ₹27,350 crore, which is only ~11% of L&T’s revenue in the same period. BHEL’s order book stood at ₹1.95 lakh crore (highest ever for them) by end-FY25, but that is roughly one-third of L&T’s order book. Moreover, BHEL’s execution has been sluggish in past years, with several loss-making years. It did turn around in FY25 with ~₹2,500 crore PAT (supported by a one-time gain), but margins remain thin. L&T, by contrast, has consistently been profitable with double-digit growth. In terms of market performance, BHEL’s stock trades around 30× P/E (on a low base of earnings), similar to L&T’s P/E (~31×), but investors arguably award L&T a premium for its diversified earnings and better visibility. L&T also far outshines BHEL in return metrics (ROE 16% vs single-digit for BHEL) and in exposure to new growth areas (BHEL is trying to get into solar equipment and rail electrification, but L&T is ahead in many of those). Essentially, L&T has a more robust business model – while BHEL depends heavily on government power orders, L&T’s orders come from across sectors (power, infrastructure, hydrocarbons, etc.), making it less cyclical.
- Siemens India: Siemens is a multinational subsidiary focusing on electrification, automation, and digitalization solutions. It’s not an EPC player like L&T, but in segments like power transmission, rail electrification, and factory automation, Siemens does compete in a way. Siemens India’s scale is much smaller: in FY2024 (year ending Sep 2024), Siemens India had ~₹22,000 crore revenue – less than 1/10th of L&T’s – but with higher EBITDA margins (~13-15%). Siemens’ order book was about ₹23,560 crore as of FY24 (excluding its recently demerged energy arm). Siemens is valued richly for its technology focus – its stock trades at 60–70× earnings. L&T at ~31× looks far more moderate in comparison. Of course, the businesses are different: Siemens doesn’t have the project lumpiness L&T has, and is asset-light. But this comparison highlights that L&T’s valuation is not expensive given its growth – if one were to value its tech/services business separately, the core EPC is at a discount.
- Other Peers: There are other listed players in specific sectors – for example, ABB India (automation, robotics, electrification) with ₹8,000 crore revenue, KEC International (₹17,000 crore revenue, focused on power T&D EPC), L&T’s own former subsidiary Thermax (~₹6,000 crore, in boilers/environment systems), BEL (Bharat Electronics, ~₹17,300 crore, defense electronics). None match L&T’s breadth. KEC International (a rival in power transmission lines and railway electrification) had an order book of ~₹30,000 crore recently – again, a fraction of L&T’s. In terms of market cap, L&T at ~₹4.8 trillion is among India’s top 10 companies, whereas these peers are much smaller (Siemens ~₹1.2 trillion, BHEL ~₹0.8 trillion, ABB ~₹0.8 trillion, BEL ~₹0.9 trillion). Global peers could be companies like Fluor or Bechtel (unlisted) or Saipem, but each has different focus areas. L&T’s uniqueness is being a one-stop infrastructure proxy in a high-growth economy.
- Comparative Advantage: L&T’s edge over peers lies in its execution capabilities and diverse portfolio. It consistently converts orders to revenue on time – e.g., it delivered over 8.1 GW of power plant capacity and multiple metro lines in recent years, whereas competitors struggled. L&T also offers turnkey solutions across sectors, so it can bid for integrated projects (like smart city projects that involve construction + tech + power). Peers usually play in one niche (BHEL in boilers, ABB in factory drives, etc.). This gives L&T cross-selling opportunities and scale benefits. In addition, L&T’s balance sheet strength means it can take on mega-projects that others cannot finance or bond for – the company even indicated it’s open to forming JVs with competitors for very large contracts (> $5 billion) to manage risks. This pragmatic approach ensures L&T stays ahead in bagging marquee deals.
- Valuation Multiples: As noted, L&T’s P/E (~31× TTM) is actually in line or lower than many peers in capital goods (ABB trades ~80×, Siemens 60×) and slightly above pure-play EPC peers (KEC ~25×, etc.). Its EV/EBITDA is around 20× by our estimate (for FY25), again reasonable given ~16% EBITDA growth. Price-to-Book is ~4.9×, which might appear high, but with ROE rising to mid-teens and likely to go higher, P/B is justified (also, conglomerates with large subsidiaries often trade above book value due to SOTP, as is the case here). It’s noteworthy that analysts continue to prefer L&T – for example, Motilal Oswal and Emkay in May 2025 reiterated Buy ratings with target prices around ₹4,000 (slightly trimming targets due to near-term IT subsidiary earnings). They saw 10–18% upside from the then price of ₹3,586. Our analysis goes further, expecting ~20% upside in a year from ₹3,770, which is not a stretch considering L&T’s growth runway.
In conclusion, L&T stands out among peers for its size, scope, and execution track record. It offers a combination of growth and stability that pure manufacturing companies or pure EPC companies don’t. While short-term market sentiment can fluctuate, L&T’s fundamental strength relative to peers suggests it should command a premium valuation – and as the company delivers on growth and ROE improvement, that valuation gap could widen. Our positive view on L&T is reinforced by the peer context: it’s the clearest blue-chip to play India’s infrastructure upcycle, without the single-sector risks that peers have.
Valuation – DCF & Target Price Outlook
We value L&T using a blend of Discounted Cash Flow (DCF) analysis and relative valuation, including Sum-of-the-Parts (SOTP) to account for its subsidiaries. The key takeaway is that L&T’s current market price does not fully reflect the growth ahead and the intrinsic value of its parts.
Sum-of-the-Parts (SOTP): L&T’s conglomerate structure means a straightforward P/E can be misleading. We break it down as follows:
- Core Engineering & Construction business (Infrastructure, Energy, Hi-Tech, Development, Others): This is the “parent” operations excluding listed subsidiaries. It contributed the bulk of revenue and about ₹9,000+ crore of PAT in FY25 (after adjusting for subs). At the CMP, we estimate the market is valuing the core business at ~₹3.05 lakh crore (after subtracting the value of stakes in listed subs from total market cap). This implies the core is trading at ~18× FY25 earnings, which is low for a business growing ~15% with improving 8-10% margins. Historically, L&T’s core EPC has traded around 20-25× earnings; also, pure-play construction companies in India often trade at similar or higher multiples despite lower quality. This suggests upside potential as the core business continues to execute and deliver earnings growth.
- LTIMindtree (IT services): L&T holds 68.73% in LTIM (post-merger). LTIM’s market cap is about ₹1.55 lakh crore. So, L&T’s stake is worth ~₹1.06 lakh crore. LTIM is a fast-growing, high-ROE tech firm (FY25 ROE ~30%) and arguably could itself rerate higher as global IT spending recovers. This stake provides a solid underpinning to L&T’s valuation – effectively ~22% of L&T’s own market cap is supported by LTIM’s market value.
- L&T Technology Services (Engineering R&D services): L&T owns 73.7% of LTTS. LTTS’s market cap is ~₹46,000 crore, so L&T’s share is ~₹34,000 crore. LTTS is unique in the listed space as an ER&D specialist and commands a premium valuation (P/E ~35×). This stake is about 7% of L&T’s market cap.
- L&T Finance Limited (NBFC): L&T holds 66.2% of this financing arm. L&T Finance’s market cap is ~₹50,000 crore, so L&T’s portion is ~₹33,000 crore. That’s another ~7% of L&T’s market cap.
Adding up the subsidiary stakes: ₹1.06L cr (LTIM) + ₹0.34L cr (LTTS) + ₹0.33L cr (L&T Finance) ≈ ₹1.73 lakh crore. This is around 36% of L&T’s total market cap (₹4.8 lakh cr). If we also consider L&T’s minor holdings (like in some JVs, or other investments), the number might be slightly higher. The remaining ~64% (₹3.05 lakh cr) is what the market assigns to L&T’s core business. On an Enterprise Value basis, after adjusting for debt and cash, the core EV/EBITDA is about ~13–14× by our estimates, which feels low given L&T’s dominance and 16% EBITDA growth in FY25. In comparison, many global EPC firms trade at 8-10× EV/EBITDA but with low growth, whereas Indian capital goods firms trade at 20-30× EV/EBITDA due to growth prospects. Thus, SOTP reveals hidden value – the market is not overpaying for L&T; if anything, the core operations are at a discount to peers and its own history. In fact, one analysis noted that L&T is at only ~22× FY25E earnings, which is below its historical average valuation multiple.
DCF Valuation: We project L&T’s consolidated cash flows over the next 5 years, factoring in the current order book and likely order additions. Key assumptions: (a) Revenue growth ~15% CAGR for next 3 years (in line with guidance of 15% in FY26, then taper to ~12% by years 4-5), (b) EBITDA margin improving to ~11-12% by FY28 (from ~10.5% now), as operating leverage and better mix (higher IT/defence share) kick in, (c) Capex intensity remains moderate (L&T has guided capex largely to maintenance and a few growth areas like green hydrogen – overall capex ~₹5-7k cr per year, easily covered by depreciation), (d) Working capital stays around current levels (~20 days net working capital), thanks to focus on cash conversion. Using a discount rate (WACC) of ~11.5% (this considers cost of equity ~13% given market risk in India, and cost of debt ~8% post-tax, and L&T’s debt-equity mix) and a terminal growth rate of 5% (reasonable given India’s expected long-term GDP growth ~6-7% nominal, and L&T’s likely continued role in infra), our DCF model yields an equity value for L&T on the order of ₹5.5–6 lakh crore. This would translate to a per-share value around ₹5,800–₹6,300 (assuming ~93.6 crore shares, post buybacks – note: L&T had a buyback in 2019 and could consider more in future). Even taking a more conservative terminal growth of 4% or a higher WACC, the DCF fair value comes above ₹5,000/share. The DCF essentially says that L&T’s growth and cash generation can justify a stock price significantly higher than the current CMP – provided it executes as expected.
Triangulating all methods, we are comfortable to assign L&T a 1-year forward target P/E of ~28× on FY26 earnings. L&T’s FY26 EPS (consolidated) is projected to be ~₹160 (assuming ~20% growth over FY25’s normalized EPS ~₹133). At 28×, that gives ~₹4,480, say ~₹4,500 target in one year. This is in line with our DCF and SOTP reasoning. It also implies a PEG ratio ~1.5 (for ~18% EPS CAGR), which is reasonable for a blue-chip with such competitive advantages. For 2 years out (FY27), EPS could be ~₹180-185; even if the P/E contracts to ~26×, that yields ~₹4,800-4,900. For 3 years out (FY28), EPS might approach ₹200+, and at a modest 25× (to be conservative), the stock could be ~₹5,000. However, given the long-term infrastructure upcycle and L&T’s likely strong position, it could sustain a higher multiple – say 28× – which would give ~₹5,600 (which is ~50% higher than CMP). These scenarios align with our stated upside of ~20% (1yr), ~30% (2yr), ~50% (3yr).
It’s worth noting that brokerage consensus is also bullish. Current analyst consensus (from 20+ analysts) has a Buy rating with an average 12M target around ₹4,200-4,300, and some most bullish estimates near ₹5,000. Our target of ₹4,500 is slightly above consensus, reflecting our optimism on order inflow conversion and potential valuation rerating as ROE improves. Also, if global investors increase allocation to India’s infrastructure theme, a stock like L&T could see multiple expansion.
Risks to valuation: If execution were to falter or if there’s an economic downturn cutting new orders, L&T might grow slower, affecting our DCF. Additionally, any spin-offs or stake sales (e.g., if L&T were to divest part of LTIM or L&T Finance) could unlock value but also remove that income stream – though likely value-accretive, it changes the composition. We have not assumed any such corporate action in our base case.
In summary, our valuation indicates L&T is an attractive investment at current levels, with significant upside potential over a medium-term horizon. The company offers growth akin to mid-cap companies but with the balance sheet and pedigree of a large-cap, which is a rare combination. Below we discuss the technical view which also supports a positive stance.
Technical View – Weekly Chart
Technical analysis suggests a supportive outlook for L&T’s stock price. On the weekly chart, L&T has been trading in a broad range for the past several months, reflecting a consolidation after a strong rally in 2022–2024. The stock’s range roughly spans from ₹3,237 on the support side to about ₹3,880 on the resistance side. This ₹3,200–₹3,900 zone has contained most of the price action recently – essentially L&T has been range-bound, but for how long? Notably, the ₹3,237 level has acted as a multiple-tested support (buyers have stepped in near this level on various dips), indicating accumulation interest in that area. On the upside, the previous highs around ₹3,850-3,880 form a resistance; a break above that would mark a new all-time high and a likely bullish breakout from consolidation.
(Chart below: Weekly candlestick chart of L&T showing the trading range and key support/resistance levels.)
Weekly candlestick chart for L&T (NSE) with key support (₹3,237) and resistance (₹3,880) levels marked. The stock has been consolidating in this range in 2024. A breakout above the range would signal continuation of the long-term uptrend.
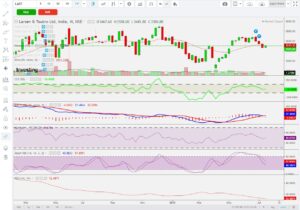
Current price action (around mid-₹3,400s) is closer to the lower end of the range, which from a risk-reward perspective is favorable for bullish positions – downside support is nearby while the upside towards ₹3,800 is intact. The weekly chart also shows that the stock is hovering around its medium-term moving averages. One analysis pointed out it was trading just below the 44-week simple moving average (~₹3,865) which gave a mild bearish bias short-term. However, unless the support breaks, this is more of a consolidative phase than a downturn.
Momentum indicators are showing early signs of a potential upturn. The Relative Strength Index (RSI) on weekly timeframe had dipped but is now approaching a key mid-level (~50-55). A technical post noted that RSI was near 52 and a break above that could shift momentum bullish. This implies that the stock’s downward momentum has weakened and it’s attempting to stabilize. Similarly, other indicators like the Moving Average Convergence Divergence (MACD) on weekly are around the zero line, poised to turn positive if price gains a bit.
We have identified a descending trendline from the recent highs; a move above ~₹3,490 could signal a trend reversal to uptrend. In fact, the stock briefly moved above ₹3,500 recently, and if it sustains, that would be a bullish sign. Volume patterns: There hasn’t been d istribution volume of concern – volume has been normal during the pullback, suggesting no large-scale selling by institutions; this supports the view that the pullback is corrective, not a trend change.
To summarize the technical outlook: L&T’s long-term trend remains positive (higher highs and higher lows on a multi-year chart). The stock had rallied strongly and is now digesting gains in a horizontal range. As long as the ₹3,200-3,250 support zone holds, the bulls have the upper hand for the next move. A breakout above ₹3,880 would likely unleash a fresh rally – potentially towards ₹4,200 (next psychological level) and then our target around ₹4,500. On the downside, a breach of ₹3,200 could trigger some caution and possibly a slide to ₹3,000, but there’s no indication of that currently, and fundamentally we’d view such a dip as a buying opportunity.
In fact, one technical analysis highlighted that L&T was at a “strong demand zone, showing signs of reversal” with bullish RSI divergence, offering a good risk-reward for buyers if support holds. Another flagged that the consolidation is forming a base for a possible big move coming – the only question is direction, but given the fundamental backdrop, we lean towards an upward resolution.
Thus, the technical picture aligns with our fundamental optimism. We expect L&T to resume its uptrend after this healthy consolidation, and the weekly chart will be one to watch for that breakout confirmation.
Key Growth Drivers & Catalysts
Several factors are likely to drive L&T’s growth in the coming years, reinforcing our bullish stance:
- Record Infrastructure Spending in India: The central government’s unprecedented capex push is a direct catalyst for L&T. In FY24, the government spent ~₹7.5 lakh crore on capex (a record then) and has budgeted ₹10+ lakh crore for FY25, with a focus on transportation (roads, railways, metros, ports) and urban infrastructure. This includes projects like the Gati Shakti masterplan (multi-modal logistics parks, freight corridors), 100+ new airports under UDAN, river-linking projects, and smart cities. As India aims for a $5 trillion economy, infrastructure is the backbone – and L&T, being the top domestic player, will corner a substantial share of these projects. For example, in High-Speed Rail, metro rail, and expressways, L&T has already won marquee contracts. States are also increasing capex, and L&T’s order book includes major state projects (e.g., Mumbai trans-harbour link, Chennai Metro, Bangalore Metro). Continued policy emphasis on infra (the FY2025-26 Budget further raised capex to ₹11.2 lakh cr) ensures a multi-year growth runway for L&T.
- Private Sector Capex Revival and Manufacturing Uptick: After a long lull, private capex in India is picking up in sectors like steel, cement, data centers, electronics manufacturing, and chemicals. Companies are building new factories and capacities to take advantage of Production-Linked Incentives (PLI) schemes in electronics, solar manufacturing, EVs, etc. L&T’s Buildings & Factories division is seeing more factory orders (for instance, smartphone manufacturing plants, data center buildings). Furthermore, foreign investments (e.g., multinational companies setting up facilities in India, such as chip packaging units or renewable factories) often turn to L&T as a construction partner. This trend aligns with the “China+1” diversification – as global firms set up in India, L&T benefits. L&T management noted strength in segments like “heavy civil infrastructure, renewables, power T&D, minerals & metals” in the project pipeline – many of these are driven by either government schemes or private capex in green energy and mining.
- Rising International Orders – Middle East & Beyond: L&T has strategically grown its international business, which now forms ~50% of revenue and orders. The Middle East region in particular is on the cusp of a infrastructure boom (fueled by oil windfall and events like Saudi’s Vision 2030, Qatar’s expansion plans, UAE’s projects ahead of global expos). L&T is a respected name there – it has executed airports, luxury high-rises (e.g., in Dubai), and petrochemical plants. In FY25, 70% of L&T’s Q4 orders came from international markets, underlining this trend. Not only does this diversify L&T’s portfolio (reducing reliance on Indian spending cycles), but often these orders are larger ticket size and fast-track. The risk is fixed-price nature, but L&T prices in contingencies. The upside is that margins can surprise on the upside if execution is efficient (and L&T has been improving its project execution with digital tools). Additionally, L&T has ventured into new geographies – e.g., it won a significant order in Africa and is exploring projects in countries like Bangladesh, which adds to growth avenues.
- Improving Margins & Operational Efficiency: A critical driver for earnings growth (and stock re-rating) is margin expansion. L&T has several initiatives here. One, as older low-margin projects are executed and newer orders are bid with better cost economics, the overall margin profile is improving. For instance, commodity price stabilization (steel, cement cooled off from 2022 highs) helped L&T expand its EBITDA margin by 20 bps to 11% in FY25 and they target 8.5% margin in core E&C for FY26 (vs 6.4% achieved in FY25 in infra). Two, digitalization: L&T’s Project EDGE and other digital initiatives are optimizing project management – using IoT at sites, predictive maintenance for equipment, and real-time dashboards for project progress. These reduce delays and wastage, ultimately aiding margins. Three, L&T is collaborating in JVs for very large projects, which means it can take on huge orders without straining resources, and share risks/costs – this prudent approach can protect margins on mega-deals (better to have 60% of a profitable $5bn project than 100% of a risky one). All these efforts suggest that L&T’s profitability is on an upward trajectory, which directly drives EPS growth.
- Strategic Portfolio Shifts (Lakshya 2026 goals): L&T’s management is not resting on traditional business – they have a clear vision to transform the company by FY26. Under Lakshya ’26, they aim to double revenues to ~₹2.7 trillion and order inflows to ₹3.4 trillion by FY26 from the FY21 base, and triple net profit (implied by aiming for ROE 18% from 10%). To achieve this, L&T is exiting or reducing exposure to non-core and low-return businesses and focusing on high-growth areas:
- They sold the Electrical & Automation business (₹14k cr deal in 2020) and the MF business (₹~3k cr deal) – freeing capital.
- They are scaling IT and technology services, which as discussed, will form a larger share of profits (targeting ~40% of market cap from IT/TS arms vs ~30% earlier).
- They’re investing in “new age” businesses: Green Energy (e.g., electrolysers for green hydrogen, utility-scale battery storage EPC), Data Centres (they have a partnership to develop data centre parks – a high-demand area as digital data soars), and Semiconductor manufacturing support (recent acquisition of a chip design firm to enter semiconductor tech). These could become significant in the next 5-10 years given India’s thrust on semicon and renewable capacity – L&T is positioning early.
- L&T is also leveraging its engineering might in emerging areas like offshore wind farms infrastructure, metro rail systems exports (some countries want to import India’s metro expertise), and defence exports (e.g., L&T-made artillery could be sold to foreign armies in friendly nations). Any success in these can be big catalysts, although our base case doesn’t bank on them heavily (they’re “free” options in our view).
Essentially, Lakshya 2026 is about making L&T a leaner, tech-driven, higher-ROE enterprise. Progress is evident – by FY25, they’ve nearly achieved the revenue target (₹2.55T vs ₹2.7T goal) and exceeded the order inflow target (₹3.56T vs ₹3.4T goal). This over-achievement gives credibility to management’s execution capabilities. If they deliver on the profit/ROE goal by FY26, the market will likely reward L&T with a higher valuation multiple.
- Interesting Fact – L&T’s Unmatched Legacy: It’s worth highlighting an interesting tidbit: L&T has built some of the most iconic projects in Indian history – from engineering components of India’s first nuclear reactors, constructing landmark buildings like the high-rise Residential Towers of Mumbai, to developing ISRO’s launch complexes. Such a legacy isn’t directly a financial driver, but it manifests as a competitive moat – brand trust. For instance, when a critical, complex project is tendered, L&T’s name commands trust that it can be completed. This often gives it an edge in winning contracts, especially in design-build-operate types. A fun fact: L&T famously thwarted a hostile takeover attempt by Ambani’s Reliance in the 1980s, with employees rallying to keep its independence – showcasing the strong culture within. Also, L&T’s contribution to nation-building often aligns it with policymakers’ vision, meaning it’s likely to remain a preferred partner for government initiatives (like the recent contract to build part of the Ayodhya temple complex, or involvement in upcoming smart city projects).
On a numbers note, L&T now employs over 412,000 people (including all subsidiaries) – making it one of the largest employers in the country. Its ability to manage such scale is itself a driver; it can ramp up manpower on projects faster than most competitors. And despite being 85+ years old, L&T has managed to stay modern and relevant – an intangible catalyst that many conglomerates lack.
In summary, the growth drivers for L&T span immediate-term (government orders, current backlog execution) to medium-term (new ventures, private capex) and even long-term (strategic diversification). This multi-layered growth story, coupled with L&T’s strong fundamentals, underpins our positive outlook on the stock.
Risks & Considerations
No investment is without risks, and it’s important to weigh the potential downsides in L&T’s case:
- Execution Risks & Cost Overruns: L&T’s projects are often large and complex, which carries execution risk. Any delays, design challenges, or contractor issues can lead to cost escalations that hurt margins. Fixed-price contracts, especially overseas, mean L&T bears the risk of any cost increase. For example, a sudden spike in steel or cement prices during execution can erode project margins if not hedged. L&T does have a robust risk management (they add escalation clauses in some contracts, and hedge commodity exposure where possible), but not all variability can be passed through. Complex projects like metros or nuclear, by nature, can face unforeseen hurdles (geological surprises, regulatory delays). If several projects were to face issues simultaneously, L&T’s financial performance could be impacted. Mitigation: L&T’s experience and past record give confidence – e.g., it navigated the pandemic lockdowns with minimal project cancellations (some slowdowns but no big write-offs). The company also provisions conservatively; still, this remains a key risk to monitor.
- Economic Slowdown or Capex Cycle Reversal: L&T’s fortunes are tied to capital expenditure cycles. If India’s economic growth slows significantly or government finances strain (reducing infra spending), new order inflows could suffer. Likewise, a global recession could delay private capex or Middle East projects. A scenario of high interest rates and tight liquidity can also make it harder for L&T’s clients to fund projects, potentially leading to order deferrals or even cancellations. For instance, if crude oil prices crash and stay low, Middle Eastern clients might cut back spending (though currently oil is at levels that encourage spending). Mitigation: L&T’s diversification helps – an Indian slowdown might be offset by Middle East projects or vice versa. Also, infrastructure spending is often counter-cyclical (governments increase it to revive economies).
- Competition and Pricing Pressure: While L&T is top dog domestically, competition is not absent. In government tenders, public sector units (like NBCC, which does buildings; Ircon, which does rail projects) and increasing foreign bidders (for metro projects, companies from Turkey, Russia, etc., have bid) can sometimes undercut on price. Aggressive bidding by competitors could pressure L&T to either lower its bid margins or lose some projects. In power equipment, Chinese competition (for boilers/turbines) hurt BHEL in the past; if Chinese firms start bidding EPC in India (less likely currently due to geopolitical tensions), that could be a risk. In IT services, L&T’s subs compete with TCS, Infosys etc., which is tough; any falter in their performance can affect consolidated numbers. Mitigation: L&T’s scale and credibility often allow it to command a premium or win on non-price factors (tech capability, delivery timing). Nonetheless, competition could intensify, so we watch bid-win ratios carefully (so far, L&T has maintained a healthy win rate on major tenders).
- Regulatory and Political Risks: As a contractor on many public projects, L&T is subject to political risk – changes in government or policy can impact projects. E.g., if a new administration reviews infrastructure contracts, there could be delays or even cancellations (though such cases are rare, and contracts are usually honored). Land acquisition or environmental clearance issues can stall projects (not directly L&T’s fault, but affects execution). On the international front, geopolitical issues (sanctions, war) could pose risks – for instance, L&T had to pull out staff from some Middle East sites during geopolitical tensions historically. Also, its increased engagement in defense means some reliance on government orders and acceptable export permissions.
- Working Capital & Cash Flow Management: EPC businesses can face cash flow stress if clients delay payments or if retention money is stuck. L&T has managed to cut its working capital to 19 days, which is excellent, but if that were to reverse (say government clients delay payments in a crunch), working capital could expand and debt might rise. Additionally, L&T Finance (the NBFC) is subject to credit cycle risks – a downturn could raise NPAs and require higher provisioning, which would drag consolidated profits. However, L&T Finance’s shift to retail has reduced this risk somewhat (retail portfolio is granular and so far performing well).
- Valuation Risk: Despite our view that L&T is undervalued, the stock’s performance can be affected by overall market sentiment. In a rising interest rate environment, for instance, infrastructure stocks sometimes de-rate. If the market starts valuing conglomerates at a discount (conglomerate discount thesis), L&T’s diverse portfolio could trade weaker than pure-play peers. Also, any disappointment in quarterly earnings versus expectations could lead to short-term stock volatility (e.g., if IT subsidiary margins fall or a big project gets provisioned, analysts might cut estimates, pressuring the stock).
In weighing these risks, we note that L&T has historically navigated challenges adeptly. The company has seen multiple economic cycles, interest regimes, and even political shifts, yet managed to grow and remain profitable through them. Its sheer order book size and diversified nature give it a cushion – not all segments underperform at once. Moreover, its conservative financial management (low net leverage, decent cash, hedging policies) provides resilience.
Finally, it’s worth mentioning ESG (Environmental, Social, Governance) aspects: L&T is often engaged in environmentally sensitive projects (construction can impact environment). The company has a strong sustainability framework and is increasingly focusing on green projects (renewables, etc.), but any major environmental incident or activism could pose reputational risks. Governance-wise, L&T is widely regarded for professional management (no dominant family owner, which is unique in India; it’s institutionally managed). This is a plus from an investor standpoint, as decisions are generally merit-based and aligned to shareholder value (e.g., disciplined capital allocation). No major red flags on governance are noted in recent times.
In conclusion, the risk-reward for L&T appears favorable. The risks enumerated are real but manageable and are outweighed in our view by the strong growth drivers and L&T’s capabilities. Investors should keep an eye on order inflow trends, margin trajectory, and any macro signals (budget announcements, etc.) as checkpoints. As of now, we find L&T to be a compelling investment to participate in India’s infrastructure and economic growth, with a solid margin of safety provided by its diversification and financial strength.
Sources: –
- https://www.tradingview.com/symbols/NSE-LT/
- https://www.larsentoubro.com/media/jw0daem3/2025-05-08-financial-results-for-the-year-ended-march-31-2025.pdf#:~:text=The%20total%20Loan%20Book%20as,of%20the%20total%20loan
- https://www.screener.in/company/LT/consolidated/#:~:text=Borrowings%C2%A0%2B%2080%2C846%2093%2C630%2088%2C135%2093%2C954,99%2C597%20111%2C112%20119%2C745%20136%2C921%20149%2C050
- https://www.moneycontrol.com/news/business/economy/lt-aims-at-doubling-revenue-and-order-inflow-in-five-years-8512201.html#:~:text=L%26T%20aims%20at%20revenue%20of,exceptional%20items%2C%20reported%20in%20FY21
- https://economictimes.indiatimes.com/
- https://www.reuters.com/
- https://press.siemens.com/global/en
Analyst Name: Pradeep Suryavanshi
Bestmate Investment Services Pvt. Ltd.:
A-1-605, Ansal Corporate Park Sec-142, Noida 201305
CIN: U74999UP2016PTC143375
SEBI Registration Number: IN000015996
Website: www.bestmate.in
Email: pradeep@bestmate.in
Disclaimer: Please read the Following very carefully:
“Investments in securities market are subject to market risks. Read all the related documents carefully before investing.”
- Registration granted by SEBI and certification from NISM in no way guarantee performance of the intermediary or provide any assurance of returns to investors.
- The fees are paid for research Report or Research recommendations and is not refundable or cancellable under any circumstances.
- We do not provide any guaranteed profit or fixed returns or any other services. We charge fixed fees and do not operate on any profit-sharing model.
- Images if any, shared with you are for illustration purposes only.
- We are not responsible for any financial loss or any other loss incurred by the client.
- Please be fully informed about the risk and costs involved in trading and investing. Please consult your investment advisor before trading. Trade only as per your risk appetite and risk profile.
- Trading/investing in stock market is risky due to its volatile nature. Upon accepting our service, you hereby accept that you fully understand the risks involved in trading/investing.
- We advise the viewers to apply own discretion while referring testimonials shared by the client. Past performances and results are no guarantee of future performance.
- All Report or recommendations shared are confidential and for the reference of paid members only. Any unapproved distribution of sensitive data will be considered as a breach of confidentiality and appropriate legal action shall be initiated.
- The Research Report or recommendations must not be used as a singular basis of any investment decision. The views do not consider the risk appetite or the particular circumstances of an individual investor; readers are requested to take professional advice before investing and trading. Our recommendations should not be construed as investment advice.
- In case of any query, please email on Info@bestmate.in be rest assured, our team will get back to you and resolve your query. Please state your registered phone number while mailing us.
- Reports based on technical and derivative analysis center on studying charts of a stock’s price movement, outstanding positions and trading volume, as opposed to focusing on a company’s fundamentals and, as such, may not match with a report on a company’s fundamentals.
Disclosure Document
The particulars given in this Disclosure Document have been prepared in accordance with SEBI(Research Analyst)Regulations,2014.The purpose of the Document is to provide essential information about the Research and recommendation Services in a manner to assist and enable the prospective client/clients in making an informed decision for engaging in Research and recommendation services before investing.
For the purpose of this Disclosure Document, Research Analyst is Pradeep Suryavanshi Director, of Bestmate Investment Services Pvt Ltd (hereinafter referred as “Research Analyst”)
Business Activity: Research Analyst is registered with SEBI as Research Analyst with Registration No. INH000015996. The firm got its registration on and is engaged in research and recommendation Services. The focus of Research Analyst is to provide research and recommendations services to the clients. Analyst aligns its interests with those of the client and seeks to provide the best suited services.
Terms and conditions:
The Research report is issued to the registered clients. The Research Report is based on the facts, figures and information that are considered true, correct and reliable. The information is obtained from publicly available media or other sources believed to be reliable. The report is prepared solely for informational purpose and does not constitute an offer document or solicitation to buy or sell or subscribe for securities or other financial instruments for clients.
Disciplinary history:
- No penalties/directions have been issued by SEBI under the SEBI Act or Regulations made there under against the Research Analyst relating to Research Analyst services.
- There are no pending material litigations or legal proceedings, findings of inspections or investigations for which action has been taken or initiated by any regulatory authority against the Research Analyst or its employees.
Details of its associates:- No associates
Disclosures with respect to Research Reports and Research Recommendations Services
- The research analyst or research entity or his associate or his relative do not have financial interest in the subject company.
- The research analyst or its associates or relatives, do not have actual/beneficial ownership of one per cent or more securities of the subject company, at the end of the month immediately preceding the date of publication of the research report or date of the public appearance.
- The research analyst or his associate or his relative do not have any other material conflict of interest at the time of publication of the research report or at the time of public appearance.
- The research analyst or its associates have not received any compensation from the subject company in the past twelve months.
- The research analyst or its associates have not managed or co-managed public offering of securities for the subject company in the past twelve months.
- The research analyst or its associates have not received any compensation for investment banking or merchant banking or brokerage services from the subject company in the past twelve months.
- The subject company was not a client of Research Analyst or its employee or its associates during twelve months preceding the date of distribution of the research report and recommendation services provided.
- The research analyst or its associates have not received any compensation for products or services other than investment banking or merchant banking or brokerage services from the subject company in the past twelve months.
- The research analyst or its associates have not received any compensation or other benefits from the subject company or third party in connection with the research report.
- The research analyst has not been engaged in market making activity for the subject company.
- The research analyst has not served as an officer, director or employee of the subject company.
- The research analyst did not receive any compensation or other benefits from the companies mentioned in the documents or third party in connection with preparation of the research documents. Accordingly, research Analyst does not have any material conflict of interest at the time of publication of the research documents.