
The Indian equity markets brace for a challenging start to the new trading week as GIFT Nifty signals a muted opening around 25,325 levels, reflecting the broader global uncertainty triggered by renewed US-China trade tensions over the weekend. Despite extending gains for two consecutive weeks with Nifty 50 posting its best weekly performance in over three months at 1.57%, the domestic markets now confront a complex backdrop of escalating geopolitical risks and mixed global sentiment.
President Donald Trump’s announcement of imposing an additional 100% tariff on Chinese goods starting November 1, responding to Beijing’s enhanced rare earth export controls, has sent shockwaves through global financial markets and threatens to undermine the recent recovery momentum in Indian equities.
Weekend Developments and Global Market Disruption
US-China Trade War Escalation
The most significant development over the weekend was President Trump’s aggressive escalation of trade tensions with China, announcing plans to impose a “massive” 100% tariff on Chinese imports from November 1, coupled with stringent export controls on critical software. This dramatic escalation came in response to China’s tightening restrictions on rare earth exports and enhanced controls on strategic materials.
The announcement triggered the largest single-day loss in US markets since April, with the S&P 500 plummeting 2.7% on Friday, the Nasdaq Composite dropping 3.56%, and the Dow Jones falling 879 points or 1.9%. The technology-heavy Nasdaq’s decline was particularly severe as it had reached an all-time high earlier in the session before the announcement.
The market selloff erased approximately $2 trillion in value from US equity markets in a single day, highlighting the significant influence of unilateral trade policy decisions on global financial stability. Cryptocurrency markets were equally devastated, with Bitcoin falling 8.4% and the entire crypto market losing $19 billion in value.
Asian Market Response
Asian markets opened Monday with widespread weakness, reflecting investor anxiety over the potential for a renewed full-scale trade war between the world’s two largest economies. Hong Kong’s Hang Seng Index futures indicated a 2.4% decline, while Shanghai Composite futures pointed to a 1.6% drop. South Korea’s KOSPI and Taiwan’s TAIEX also faced significant pressure in early trading.
However, some moderation in sentiment emerged after Trump’s weekend social media posts suggested openness to negotiations, with the President stating the US wanted to “help, not hurt” China. This slightly softened the initial market reaction, though concerns remain elevated about the potential economic impact of such aggressive trade measures.
Domestic Market Performance Review
Strong Weekly Gains Despite Volatility
The week ended October 10 marked a significant milestone for Indian markets, with both benchmark indices recording their second consecutive week of gains and the Nifty 50 achieving its best weekly performance since early July. The index gained 391.15 points (1.57%) for the week to close at 25,285.35, while the Sensex advanced 1,112.65 points (1.37%) to finish at 82,500.82.
| Index | Friday Close | Weekly Change | Weekly Change (%) | Trend |
|---|---|---|---|---|
| Sensex | 82,500.82 | 1,112.65 | 1.37 | Bullish |
| Nifty 50 | 25,285.35 | 391.15 | 1.57 | Bullish |
| Bank Nifty | 56,609.75 | 1,022.30 | 1.84 | Strong Bullish |
| Nifty IT | 40,525.85 | 445.55 | 1.11 | Bullish |
| Nifty Pharma | 24,678.45 | 227.75 | 0.93 | Bullish |
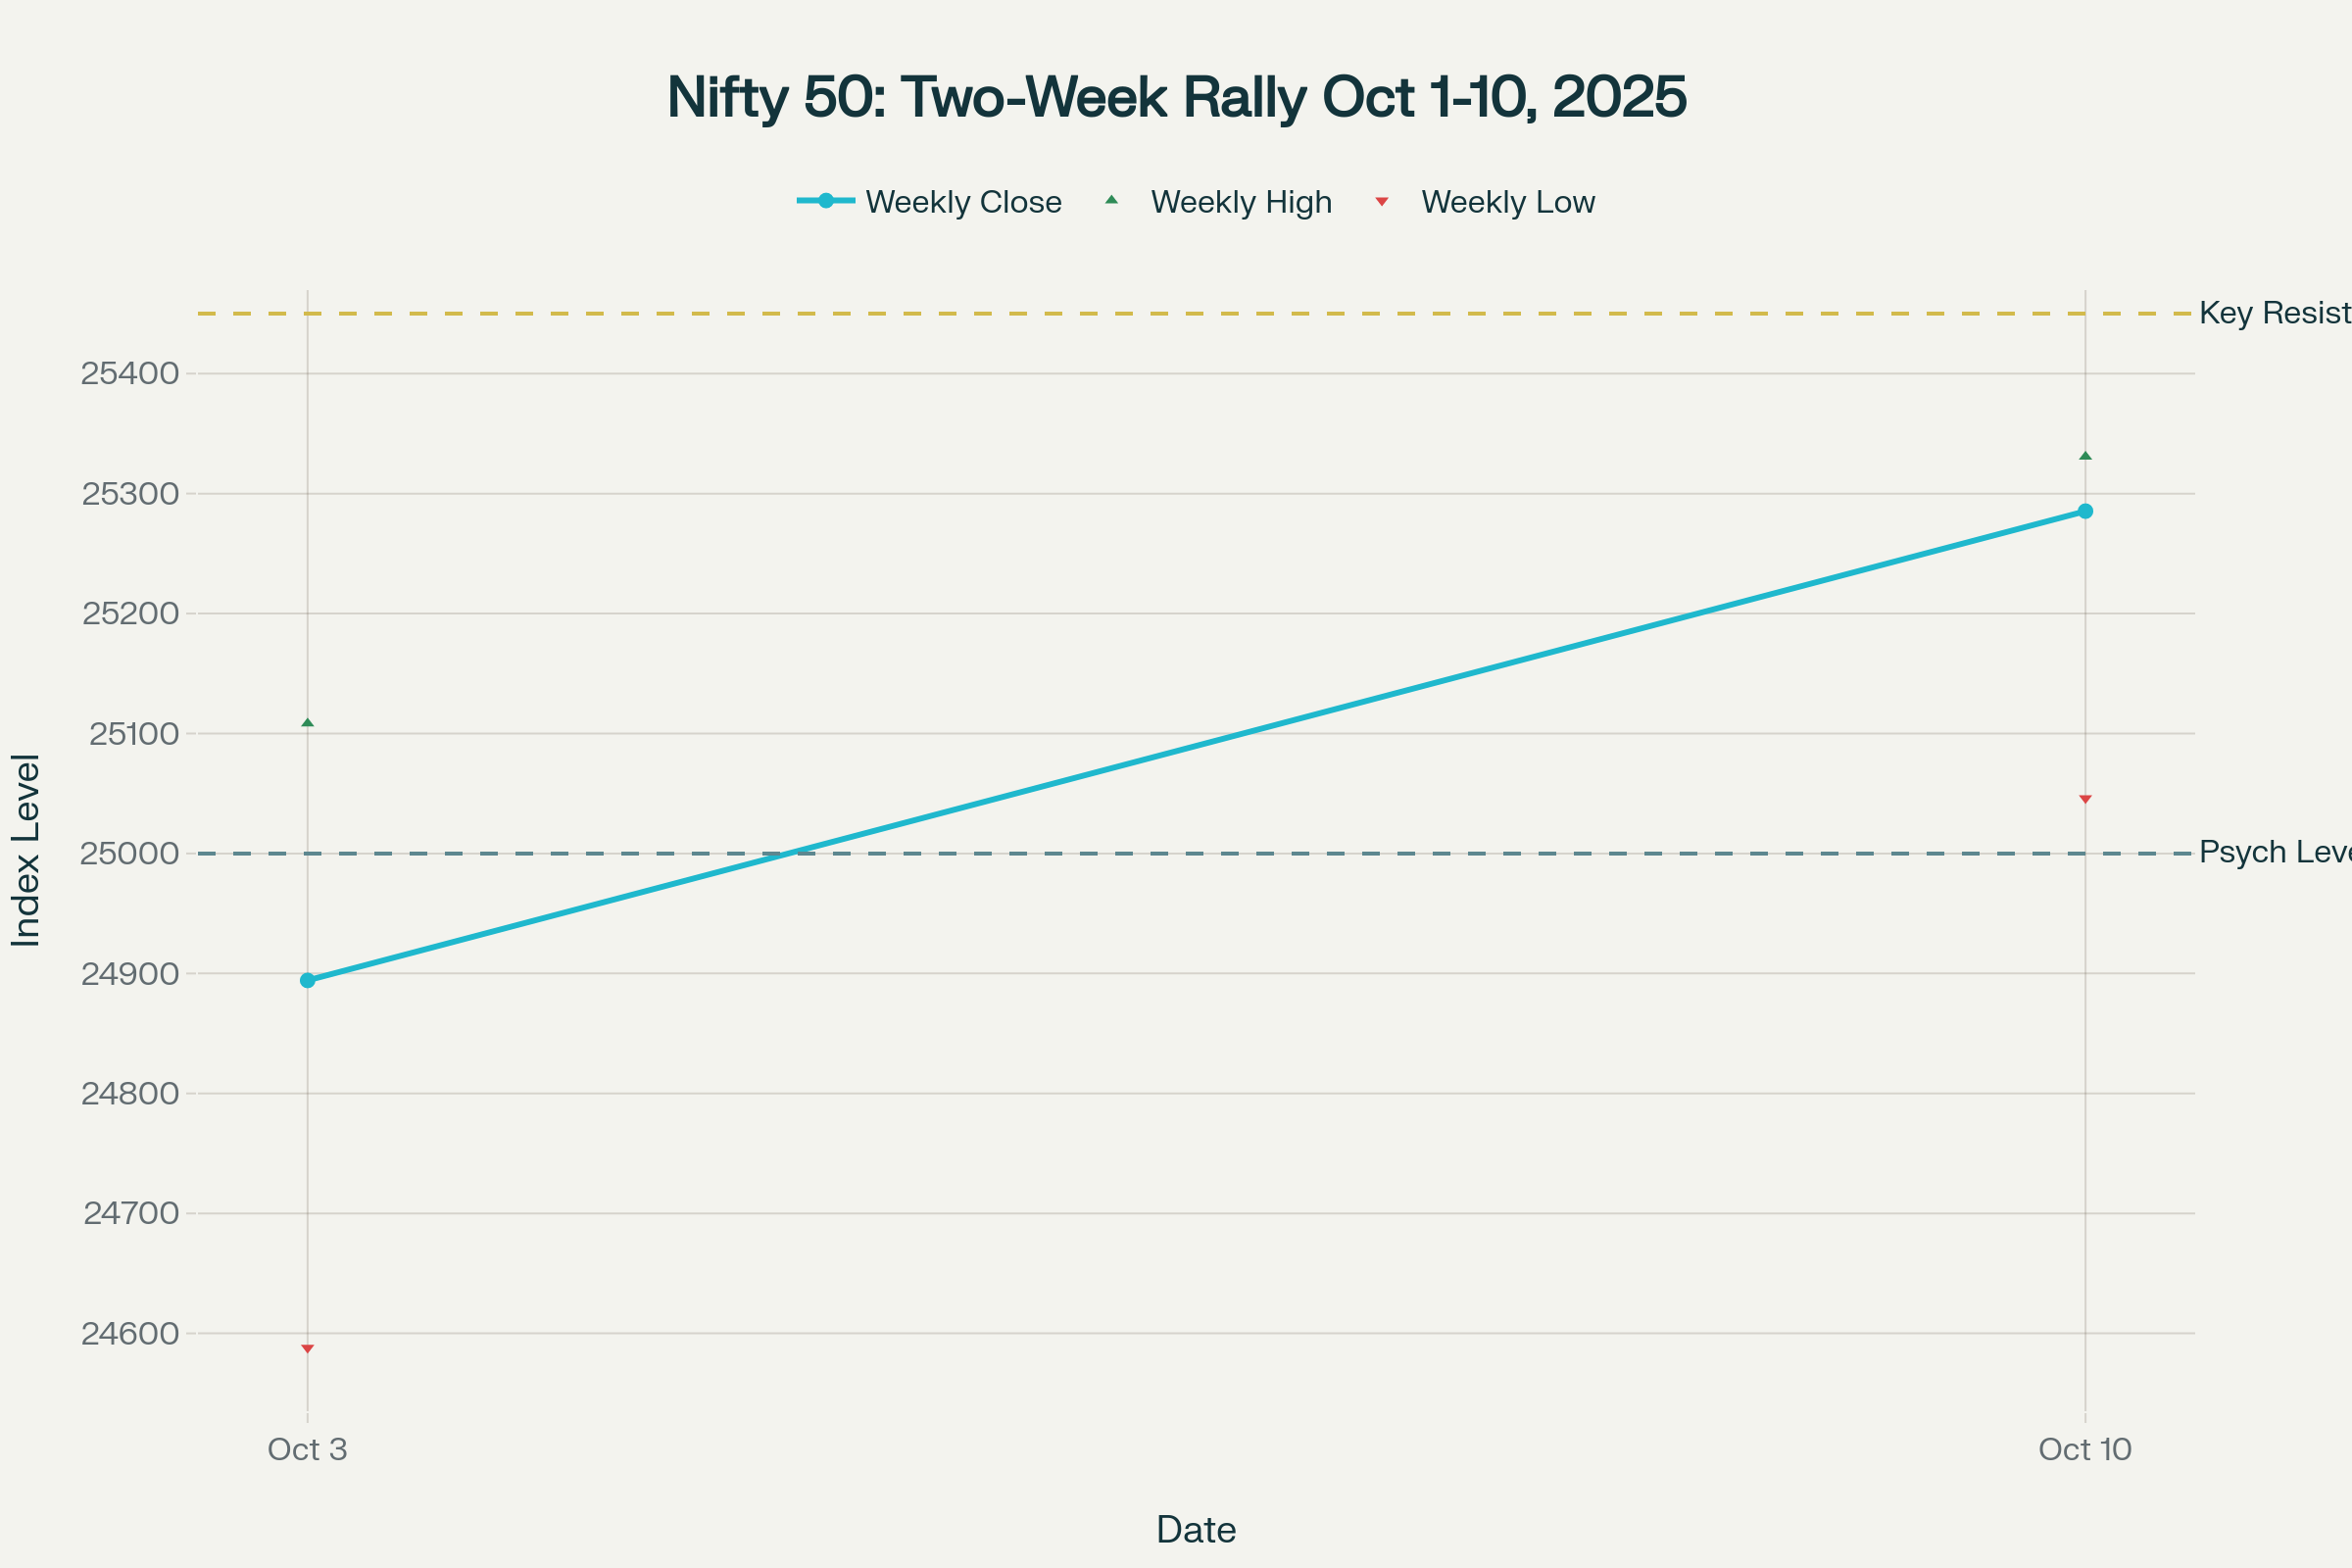 Nifty 50 shows strong two-week rally with improving price structure and higher lows
The Bank Nifty emerged as the standout performer, surging 1.84% for the week and approaching its all-time high levels near 57,300. The banking index’s strength was supported by robust quarterly business updates from major lenders and expectations of stable net interest margins amid the RBI’s neutral monetary policy stance.
Sectoral Leadership and Rotation
The week witnessed broad-based sectoral participation with seven out of eight major sectors ending in positive territory. The banking sector led the charge with its 1.84% weekly gain, followed by Oil & Gas (+1.59%) and the broader Nifty 50 index itself (+1.57%). The IT sector recovered smartly with a 1.11% gain, supported by optimism surrounding the earnings season and stable enterprise spending expectations.
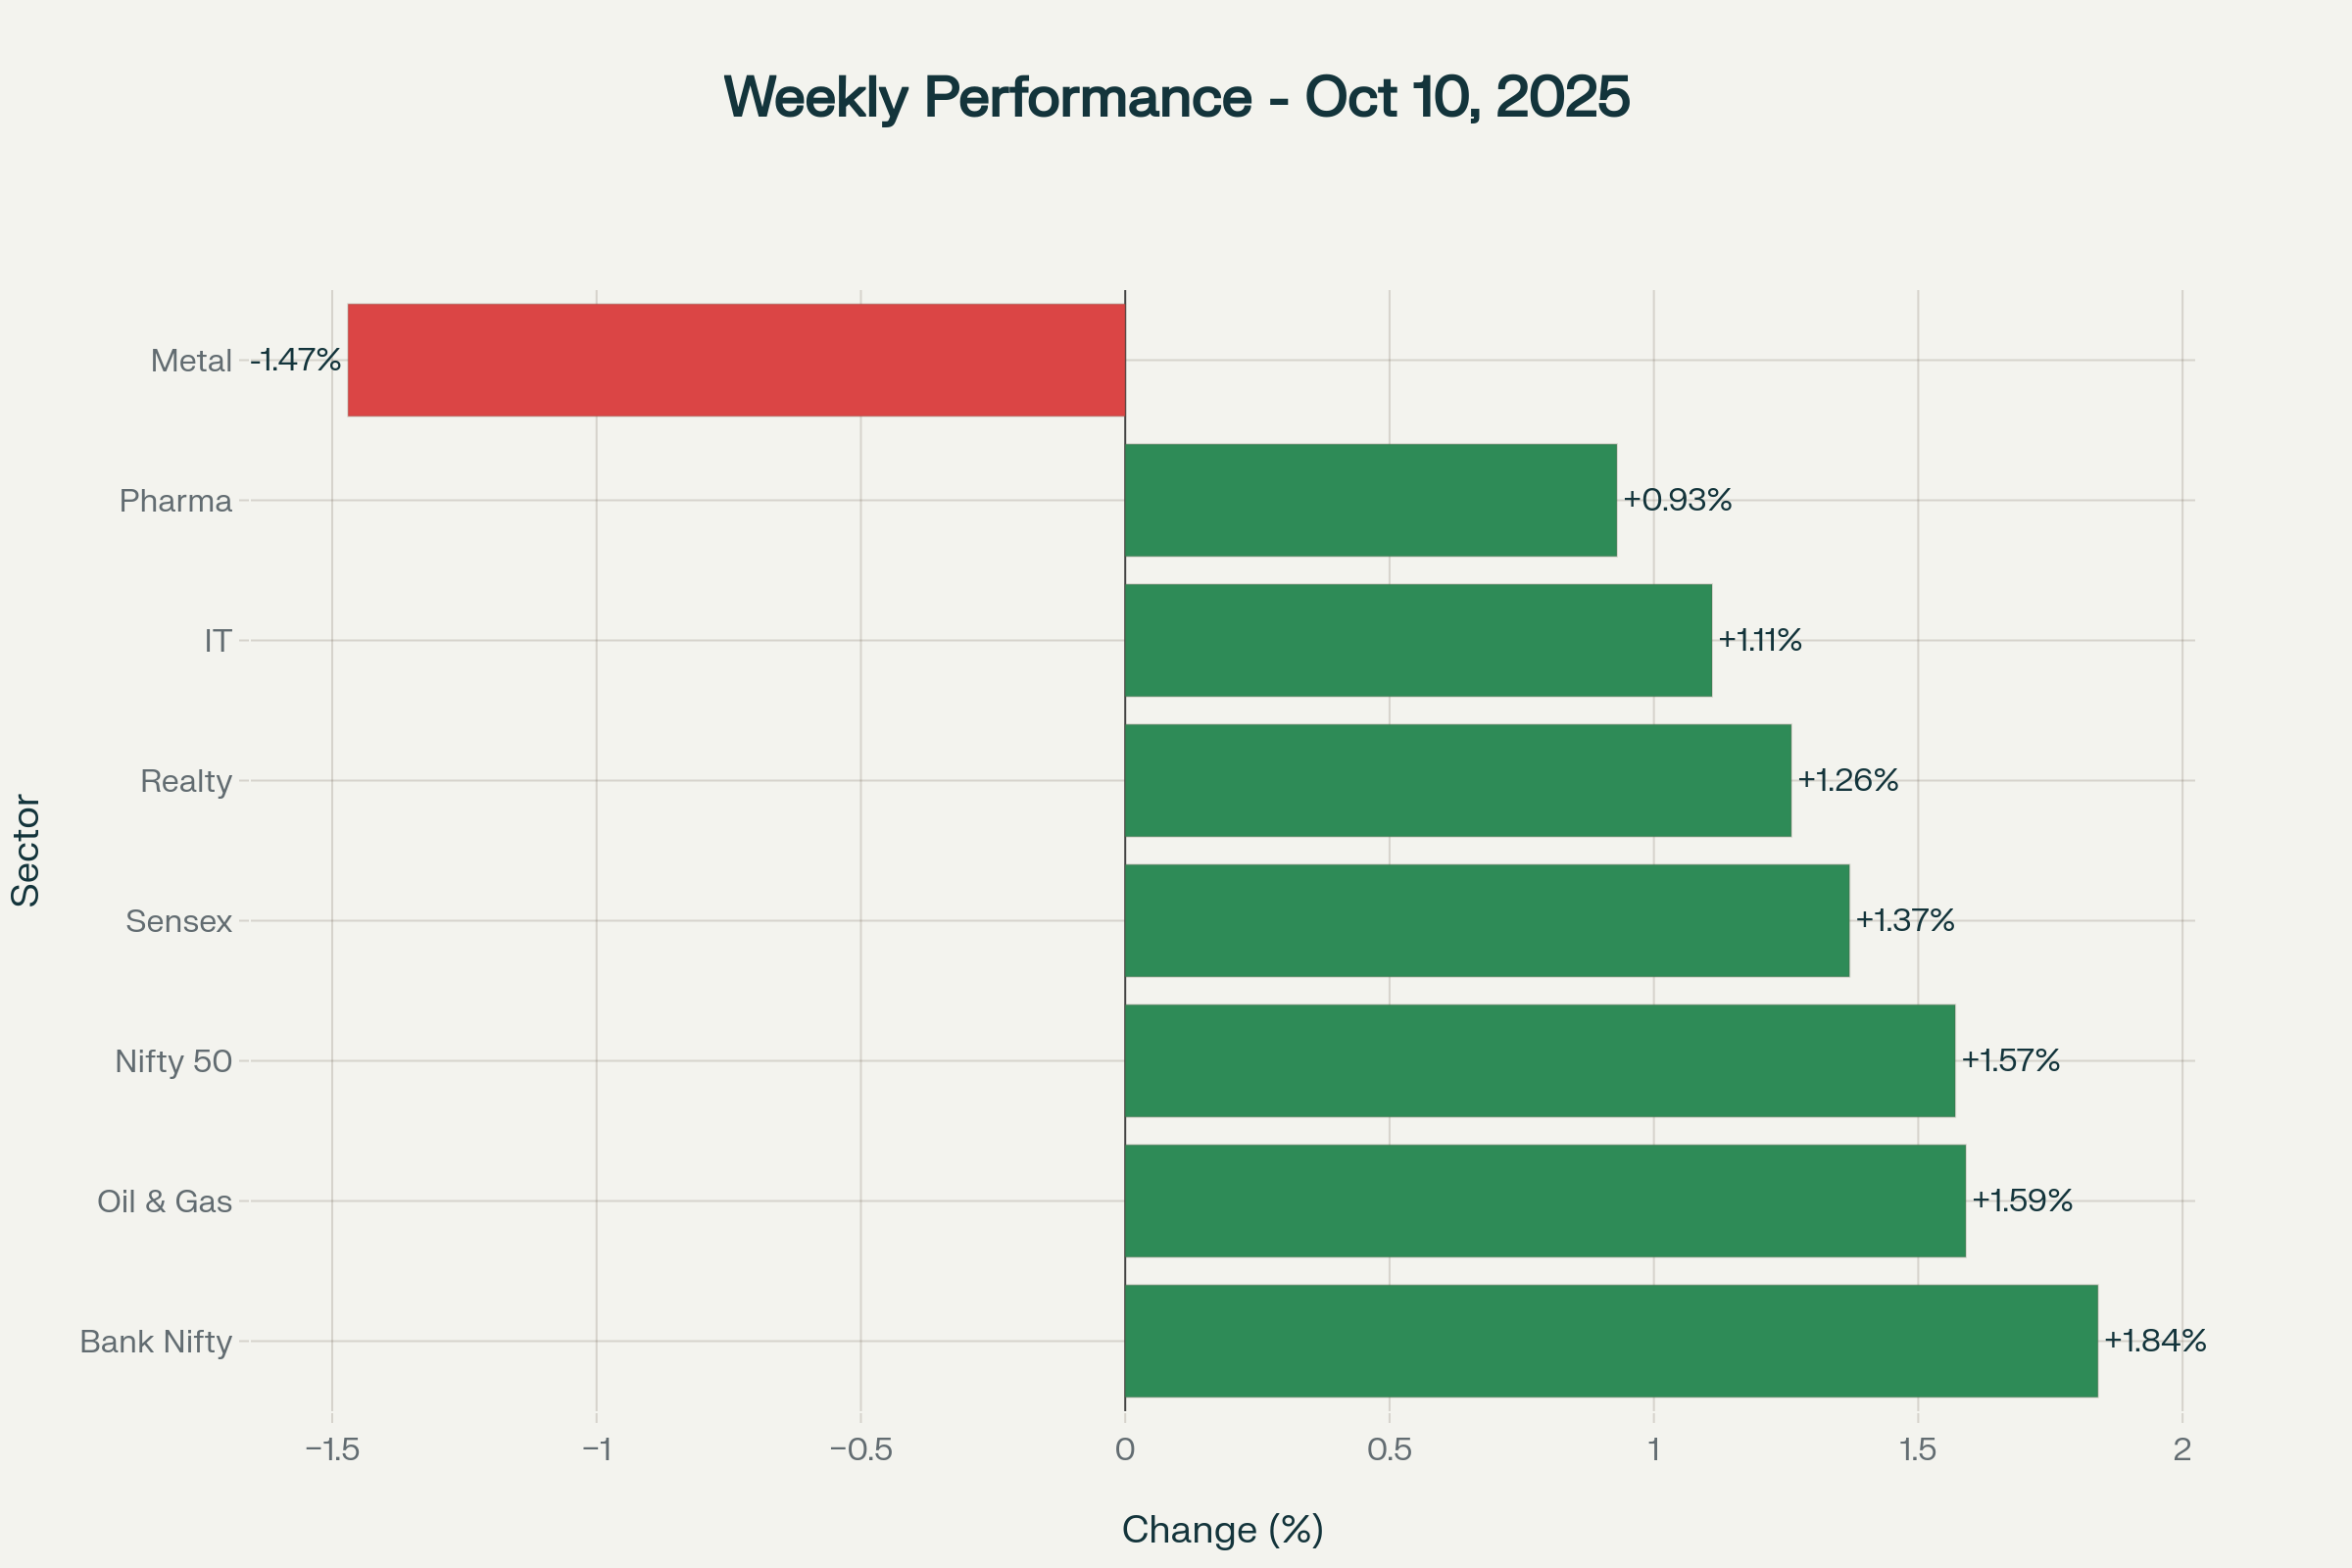 Broad-based weekly gains led by banking sector with only metals showing weakness
The only laggard was the metals sector, which declined 1.47% despite initial strength early in the week. The sector faced headwinds from concerns about global demand amid trade tensions and profit-booking after recent gains driven by supply-side disruptions.
Institutional Flow Dynamics – A Positive Turnaround
FII Sentiment Stabilizes After Volatile Start
One of the most encouraging developments has been the stabilization of Foreign Institutional Investor flows after a turbulent start to October. While FIIs recorded a modest net outflow of ₹213.04 crore for the month-to-date, this represents a significant improvement from the heavy selling pressure witnessed in the first few sessions.
The daily breakdown reveals a clear shift in sentiment, with FIIs turning net buyers in five of the last six trading sessions, including substantial buying of ₹1,440.66 crore on October 7 and ₹1,308.16 crore on October 9. This turnaround suggests growing confidence in Indian market fundamentals despite global uncertainties.
DII Support Remains Unwavering
Domestic Institutional Investors have been the bedrock of market stability, recording consistent net purchases totaling ₹11,797.01 crore for October month-to-date. Their largest single-day buying was witnessed on October 6 with net purchases of ₹5,036.39 crore, demonstrating strong conviction in the domestic growth story.
| Date | FII Net (₹ Cr) | DII Net (₹ Cr) | Combined Net (₹ Cr) |
|---|---|---|---|
| Oct 1 | -1,605.20 | 2,916.14 | 1,310.94 |
| Oct 3 | -1,583.37 | 489.76 | -1,093.61 |
| Oct 6 | -313.77 | 5,036.39 | 4,722.62 |
| Oct 7 | +1,440.66 | +452.57 | +1,893.23 |
| Oct 8 | +81.28 | +329.96 | +411.24 |
| Oct 9 | +1,308.16 | +864.36 | +2,172.52 |
| Oct 10 | +459.20 | +1,707.83 | +2,167.03 |
| MTD Total | -213.04 | +11,797.01 | +11,583.97 |
Technical Analysis and Market Structure
Nifty 50 Approaching Key Resistance
From a technical perspective, the Nifty 50 has demonstrated impressive strength by reclaiming the 25,200-25,300 zone and approaching the crucial resistance cluster at 25,400-25,450 levels. The index has successfully retraced more than 80% of its decline from the September high of 25,448 to the October low of 24,588, indicating robust recovery momentum.
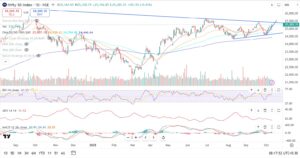
The weekly chart shows a sizable bullish candle with higher highs and higher lows, signaling continuation of the uptrend. The index has closed above all key short-term moving averages and the midline of the Bollinger Bands, while the RSI at 61 and MACD maintaining a bullish crossover support the positive technical outlook.
Key Technical Levels for October 13:
| Index | Friday Close | Immediate Support | Strong Support | Immediate Resistance | Strong Resistance |
|---|---|---|---|---|---|
| Nifty 50 | 25,285.35 | 25,100 | 25,000 | 25,400 | 25,500 |
| Bank Nifty | 56,609.75 | 56,200 | 56,000 | 56,800 | 57,200 |
The support base has shifted higher to the 25,000-24,900 zone, which includes the previous week’s low and the confluence of 20 & 50-day EMAs. A decisive break above 25,450 could trigger the next leg of the rally toward 25,670, representing the June 2025 high.
Bank Nifty Momentum Intact
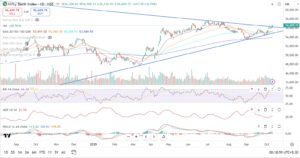
Bank Nifty continues to outperform with its technical structure decisively favoring buyers. The index has broken convincingly above the crucial supply zone of 56,100-55,800, with the bullish momentum reinforced by a positive crossover of the 20 DEMA above the 50 DEMA.
The monthly VWAP along with 10- and 20-day EMAs are clustered in the 55,900-56,156 range, providing rock-solid demand zone support. Any pullback toward 56,156 should be viewed as a buying opportunity, with the target of testing all-time highs around 57,300-57,600.
Derivative Market Insights
Volatility and Options Activity
The India VIX rose marginally to 10.12, remaining at historically low levels despite the global uncertainty. This subdued volatility reading suggests that domestic investors maintain confidence in market stability, though the reading could spike if global tensions escalate further.
The Nifty Put-Call Ratio (PCR) increased significantly to 1.41, up from 1.06 in the previous session, indicating a strong bullish bias among options traders. This elevated PCR suggests that traders are writing more puts than calls, reflecting confidence in the market’s ability to sustain current levels.
| Metric | Current Value | Previous Value | Change | Interpretation |
|---|---|---|---|---|
| India VIX | 10.12 | 10.02 | +0.10 | Low Volatility |
| Nifty PCR | 1.41 | 1.06 | +0.35 | Bullish Bias |
| Bank Nifty PCR | 1.08 | 1.05 | +0.03 | Slight Bullish |
| Max Call OI Strike | 25300 CE | 25200 CE | Shifted Up | Resistance Higher |
| Max Put OI Strike | 25000 PE | 25000 PE | Unchanged | Strong Support |
The shift in maximum call open interest from 25,200 to 25,300 strike indicates that resistance levels are moving higher, while the unchanged maximum put OI at 25,000 reinforces this level as strong support for the near term.
Earnings Season and Corporate Developments
Q2FY26 Results Gathering Momentum
The earnings season is set to intensify this week with major technology and banking sector results. HCL Technologies and Axis Bank are scheduled to announce their Q2FY26 results on Monday, which will provide crucial insights into sectoral trends and management commentary on demand outlook.
The IT sector’s performance will be particularly watched given the global economic uncertainties and their impact on enterprise spending. Early results from TCS showed modest growth with margin pressures, setting expectations for the broader sector.
Key Corporate Actions
Several significant corporate developments are expected this week:
-
Axis Bank faces regulatory scrutiny with RBI issuing a ‘Letter of Caution’ regarding KYC compliance
-
Computer Age Management Services has approved a 5:1 stock split subject to shareholder approval
-
Bulk deals in Cartrade Tech and WeWork India indicate continued private equity interest
Week Ahead: Key Events and Market Drivers
Economic Data Releases
The week is packed with crucial economic data releases that could influence market direction:
-
Monday (Oct 13): CPI Inflation data for September
-
Tuesday (Oct 14): Weekly F&O expiry amid heightened volatility
-
Wednesday (Oct 15): IIP and Manufacturing PMI data
-
Thursday (Oct 16): Weekly FII/DII flow summary
-
Friday (Oct 17): Monthly options expiry
The September CPI inflation print will be particularly crucial as it could influence RBI’s future monetary policy decisions and provide direction for interest-sensitive sectors like banking and real estate.
Global Event Calendar
Key global events to monitor include:
-
US-China trade negotiations and potential diplomatic interventions
-
Federal Reserve officials’ speeches amid the ongoing government shutdown
-
China’s Q3 GDP and trade data releases
-
European inflation data and ECB policy signals
Market Strategy and Outlook
Near-term Challenges and Opportunities
The market faces a complex set of challenges in the near term. While domestic fundamentals remain strong with robust institutional support and improving corporate earnings, the escalation of US-China trade tensions poses significant headwinds. The key will be the market’s ability to maintain support above 25,000 levels while global uncertainties persist.
Technical indicators suggest that any decline toward 25,100-25,000 should be viewed as a buying opportunity, provided there’s no escalation in trade tensions. The support base has shifted higher, and the overall trend remains intact despite near-term volatility prospects.
Sectoral Strategy
Given the current environment, a defensive yet opportunistic approach is warranted:
Overweight Positions:
-
Banking Sector: Strong technical setup and domestic growth drivers
-
IT Services: Defensive play with potential export benefits from rupee weakness
-
Pharmaceuticals: Defensive characteristics and export orientation
-
Domestic Consumption: Insulated from trade war impacts
Underweight Positions:
-
Metals & Mining: Vulnerable to global demand concerns
-
Export-oriented Manufacturing: Direct impact from trade disruptions
-
Technology Hardware: Supply chain disruption risks
Risk Management Priorities
Key risk factors to monitor:
-
Escalation of US-China trade tensions beyond current levels
-
Breakdown of key technical support at 25,000 on Nifty
-
Reversal in FII flows due to global risk-off sentiment
-
Disappointing Q2 earnings results from major corporates
-
Unexpected adverse domestic policy announcements
Trading Recommendations for October 13:
-
Defensive Opening: Given GIFT Nifty’s flat indication amid global weakness, expect a cautious start
-
Buy on Dips: Any decline toward 25,100-25,000 zone offers accumulation opportunity
-
Sector Focus: Banking, IT, and Pharma for relative outperformance
-
Risk Management: Maintain stop-losses below 24,950 for long positions
-
Options Strategy: Consider protective puts given elevated geopolitical risks
Conclusion
The Indian equity markets enter the new trading week at a critical juncture, balancing strong domestic fundamentals against escalating global trade tensions. While the two-week rally has established a solid technical foundation with Nifty approaching key resistance levels, the renewed US-China trade conflict poses significant near-term challenges.
The market’s resilience will be tested by global headwinds, but several factors provide support: unwavering domestic institutional buying, improving corporate earnings outlook, stable monetary policy environment, and strong technical structure. The shift in FII sentiment from heavy selling to cautious buying also provides encouragement.
Investors should adopt a balanced approach, using any weakness as an opportunity to accumulate quality stocks while maintaining appropriate risk management. The earnings season will provide crucial insights into corporate health, while global developments will determine the broader market sentiment.
The key levels to watch remain 25,000 on the downside for Nifty 50 and 25,450 on the upside. A sustained move above the latter could trigger the next leg of the rally toward 25,670, while a break below the former might lead to deeper consolidation.
Disclaimer: This analysis is for informational purposes only and should not be construed as investment advice. Past performance is not indicative of future results. Investors should conduct their own research and consult with financial advisors before making investment decisions.
Download full report :- Nifty OL 13-10-2025
Analyst Name: Pradeep Suryavanshi
Bestmate Investment Services Pvt. Ltd.:
A-1-605, Ansal Corporate Park Sec-142, Noida 201305
CIN: U74999UP2016PTC143375
SEBI Registration Number: INH000015996
Website: www.bestmate.in I Email: info@bestmate.in
Disclaimer: Please read the Following very carefully:
“Investments in securities market are subject to market risks. Read all the related documents carefully before investing.”
- Registration granted by SEBI and certification from NISM in no way guarantee performance of the intermediary or provide any assurance of returns to investors.
- The fees are paid for research Report or Research recommendations and is not refundable or cancellable under any circumstances.
- We do not provide any guaranteed profit or fixed returns or any other services. We charge fixed fees and do not operate on any profit-sharing model.
- Images if any, shared with you are for illustration purposes only.
- We are not responsible for any financial loss or any other loss incurred by the client.
- Please be fully informed about the risk and costs involved in trading and investing. Please consult your investment advisor before trading. Trade only as per your risk appetite and risk profile.
- Trading/investing in stock market is risky due to its volatile nature. Upon accepting our service, you hereby accept that you fully understand the risks involved in trading/investing.
- We advise the viewers to apply own discretion while referring testimonials shared by the client. Past performances and results are no guarantee of future performance.
- All Report or recommendations shared are confidential and for the reference of paid members only. Any unapproved distribution of sensitive data will be considered as a breach of confidentiality and appropriate legal action shall be initiated.
- The Research Report or recommendations must not be used as a singular basis of any investment decision. The views do not consider the risk appetite or the particular circumstances of an individual investor; readers are requested to take professional advice before investing and trading. Our recommendations should not be construed as investment advice.
- In case of any query, please email on Info@bestmate.in be rest assured, our team will get back to you and resolve your query. Please state your registered phone number while mailing us.
- Reports based on technical and derivative analysis center on studying charts of a stock’s price movement, outstanding positions and trading volume, as opposed to focusing on a company’s fundamentals and, as such, may not match with a report on a company’s fundamentals.
Disclosure Document
The particulars given in this Disclosure Document have been prepared in accordance with SEBI(Research Analyst)Regulations,2014.The purpose of the Document is to provide essential information about the Research and recommendation Services in a manner to assist and enable the prospective client/clients in making an informed decision for engaging in Research and recommendation services before investing.For the purpose of this Disclosure Document, Research Analyst is Pradeep Suryavanshi Director, of Bestmate Investment Services Pvt Ltd (hereinafter referred as “Research Analyst”)
Business Activity: Research Analyst is registered with SEBI as Research Analyst with Registration No. INH000015996. The firm got its registration on and is engaged in research and recommendation Services. The focus of Research Analyst is to provide research and recommendations services to the clients. Analyst aligns its interests with those of the client and seeks to provide the best suited services.
Terms and conditions:
The Research report is issued to the registered clients. The Research Report is based on the facts, figures and information that are considered true, correct and reliable. The information is obtained from publicly available media or other sources believed to be reliable. The report is prepared solely for informational purpose and does not constitute an offer document or solicitation to buy or sell or subscribe for securities or other financial instruments for clients.
Disciplinary history:
- No penalties/directions have been issued by SEBI under the SEBI Act or Regulations made there under against the Research Analyst relating to Research Analyst services.
- There are no pending material litigations or legal proceedings, findings of inspections or investigations for which action has been taken or initiated by any regulatory authority against the Research Analyst or its employees.
Details of its associates:- No associates
Disclosures with respect to Research Reports and Research Recommendations Services
- The research analyst or research entity or his associate or his relative do not have financial interest in the subject company.
- The research analyst or its associates or relatives, do not have actual/beneficial ownership of one per cent or more securities of the subject company, at the end of the month immediately preceding the date of publication of the research report or date of the public appearance.
- The research analyst or his associate or his relative do not have any other material conflict of interest at the time of publication of the research report or at the time of public appearance.
- The research analyst or its associates have not received any compensation from the subject company in the past twelve months.
- The research analyst or its associates have not managed or co-managed public offering of securities for the subject company in the past twelve months.
- The research analyst or its associates have not received any compensation for investment banking or merchant banking or brokerage services from the subject company in the past twelve months.
- The subject company was not a client of Research Analyst or its employee or its associates during twelve months preceding the date of distribution of the research report and recommendation services provided.
- The research analyst or its associates have not received any compensation for products or services other than investment banking or merchant banking or brokerage services from the subject company in the past twelve months.
- The research analyst or its associates have not received any compensation or other benefits from the subject company or third party in connection with the research report.
- The research analyst has not been engaged in market making activity for the subject company.
- The research analyst has not served as an officer, director or employee of the subject company.
- The research analyst did not receive any compensation or other benefits from the companies mentioned in the documents or third party in connection with preparation of the research documents. Accordingly, research Analyst does not have any material conflict of interest at the time of publication of the research documents.