
Indian equity markets are positioned for a cautiously positive opening on Thursday, November 6, 2025, following a mid-week holiday and Tuesday’s sharp decline that pushed the Nifty 50 decisively below the 25,600 mark. The benchmark indices witnessed their fourth consecutive session of losses before the Guru Nanak Jayanti holiday on Wednesday, as persistent foreign institutional selling, weak global cues, and technical breakdown below key moving averages weighed heavily on investor sentiment. As traders return to their desks after the festive break, the focus remains squarely on whether the indices can defend critical support zones or face further downside toward deeper correction levels.
Market Performance Recap: Tuesday’s Decline Extends Correction Phase
The final trading session before Wednesday’s market closure saw Indian benchmark indices conclude under significant pressure, marking a continuation of the correction that has stripped over 500 points from the Nifty 50 over the past nine sessions. The Nifty 50 closed at 25,597.65, registering a decline of 165.70 points or 0.64%, falling below the psychologically crucial 25,600 mark for the first time since early October. The BSE Sensex tumbled 519.34 points or 0.62% to settle at 83,459.15, as broad-based selling pressure engulfed the market.
The technical structure deteriorated noticeably during Tuesday’s session, with the Nifty closing below its 20-day Exponential Moving Average (EMA) positioned at 25,608 for the first time since October 3, 2025. This breakdown signaled a potential shift in short-term momentum from bullish to bearish, with analysts highlighting the formation of a “double top” pattern near the 26,100 level followed by a confirmed “lower bottom” on the daily chart. The index formed a long bearish candle with above-average volume, reflecting strong conviction among sellers.
The Bank Nifty mirrored the broader market weakness, declining 274.40 points or 0.47% to close at 57,827.05, just below the critical 58,000 psychological level. The banking index has entered a consolidation phase, trading within a broader 57,500-58,500 range after making fresh highs on October 23. Market breadth turned decisively negative, with approximately 2,439 shares declining against only 1,543 advancing stocks on the NSE, signaling widespread weakness across market segments.
The India VIX, the fear gauge, rose by 3.38% to close at 12.85, indicating a modest uptick in near-term volatility expectations as uncertainty about the market’s direction intensified. While the VIX remains below elevated levels, the upward move suggests that market participants are positioning for potential continued turbulence in the sessions ahead.
Technical Analysis: Critical Support Zones Under Scrutiny
From a technical perspective, the Nifty 50 finds itself at a pivotal juncture, with the index trading perilously close to crucial support levels that will determine whether the correction deepens or stabilizes. Market technicians have identified 25,500 as the immediate and critical support level, which must hold to prevent a cascade toward the next significant support zone at 25,400-25,448. A decisive breakdown below 25,500 could trigger accelerated selling toward 25,362 and subsequently 25,200, representing the previous swing high and a key demand area.
The Relative Strength Index (RSI) on the daily chart has dropped to 52.76, falling below the neutral 50 level and showing a bearish crossover that indicates fading momentum. The MACD (Moving Average Convergence Divergence) indicator has turned negative with a bearish crossover, and the histogram has dropped below the zero line, reinforcing the technical weakness. Both indicators suggest that the short-term trend has turned bearish, with further downside risk if support levels fail to hold.
On the upside, the index faces multiple layers of resistance that will challenge any recovery attempts. The immediate resistance is positioned at 25,718-25,750, followed by more formidable barriers at 25,800-25,850. Only a sustained breakout above 25,850, followed by a decisive move beyond 26,000, would negate the bearish implications of the recent double-top pattern and signal a resumption of the uptrend.
The Bank Nifty technical setup reveals a similar consolidation pattern, with the index taking a “breather” by forming a triangle pattern on the daily chart. Prices are consolidating within the 57,500-58,500 range, with the daily RSI hovering near 60 levels, suggesting healthy consolidation before the next directional move emerges. The immediate support lies at 57,700, below which the index could test 57,500 and potentially the 38.2% Fibonacci retracement level of the prior rally at 56,970. On the upside, a breakout above 58,000-58,100 could trigger a move toward 58,250 and the upper end of the range at 58,500.
Derivative Market Signals: Options Data Points to Range-Bound Action
The derivatives segment provides crucial insights into trader positioning and expected market behavior for Thursday’s session. Options open interest (OI) data reveals strong put writing at the 25,500 strike with 1.1 crore shares, establishing it as a firm support zone where option writers expect the index to find buying interest. Additional put support is concentrated at the 25,550 level, reinforcing the view that the 25,500-25,550 zone represents a critical demand area.
On the call side, the highest call writing is observed at the 25,700 strike with 2.3 crore shares, indicating that option sellers view this level as a formidable resistance barrier in the near term. This options configuration suggests that the Nifty is likely to trade in a 25,500-25,700 range for Thursday’s session, with breakouts on either side triggering directional moves.
For Bank Nifty, the derivatives data shows substantial put writing at 57,700 with 17.4 lakh shares, acting as key support, while call build-up at 58,000 with 13.0 lakh shares presents immediate resistance. This options positioning reinforces the technical view that Bank Nifty will likely remain range-bound between 57,700 and 58,000, with a breakout above 58,000 potentially triggering short-covering rallies toward higher levels.
The Put-Call Ratio (PCR) and implied volatility metrics suggest a cautious stance among options traders, with elevated put buying relative to calls indicating hedging activity and defensive positioning. This behavior typically precedes either a stabilization at support levels or further downside if supports break decisively.
Institutional Flow Dynamics: DIIs Provide Crucial Counterbalance
Institutional trading activity continues to reveal the stark divergence that has characterized Indian markets throughout 2025. On November 4, Foreign Institutional Investors (FIIs) extended their selling streak, offloading equities worth ₹1,067.01 crores in the cash market. FIIs sold shares totaling ₹14,254.06 crores while purchasing only ₹13,187.05 crores, marking their fourth consecutive session of net selling.
For the month of November through November 4, FIIs have been net sellers to the tune of ₹2,950.79 crores, continuing the relentless outflow trend that has pressured Indian equities. On November 3, FII selling was even more pronounced at ₹1,883.78 crores, reflecting persistent risk-off sentiment among foreign investors amid concerns about elevated valuations, subdued short-term earnings outlook, and a stronger U.S. dollar making emerging market assets relatively less attractive.
In sharp contrast, Domestic Institutional Investors (DIIs) emerged as steadfast buyers, providing critical support by net purchasing ₹1,202.90 crores worth of equities on November 4. DIIs bought shares worth ₹15,835.40 crores and sold ₹14,632.50 crores, demonstrating sustained confidence in Indian equities at lower valuations. The buying was even more robust on November 3, when DIIs accumulated ₹3,516.36 crores worth of stocks, helping cushion the market from steeper declines.
For November through the 4th, DIIs have been cumulative net buyers of ₹4,719.26 crores, providing a crucial counterbalance to foreign selling. This domestic institutional support has been instrumental in preventing a breakdown of critical support levels and limiting the downside, though the sustainability of this buying in the face of persistent FII outflows remains a key question for market direction.
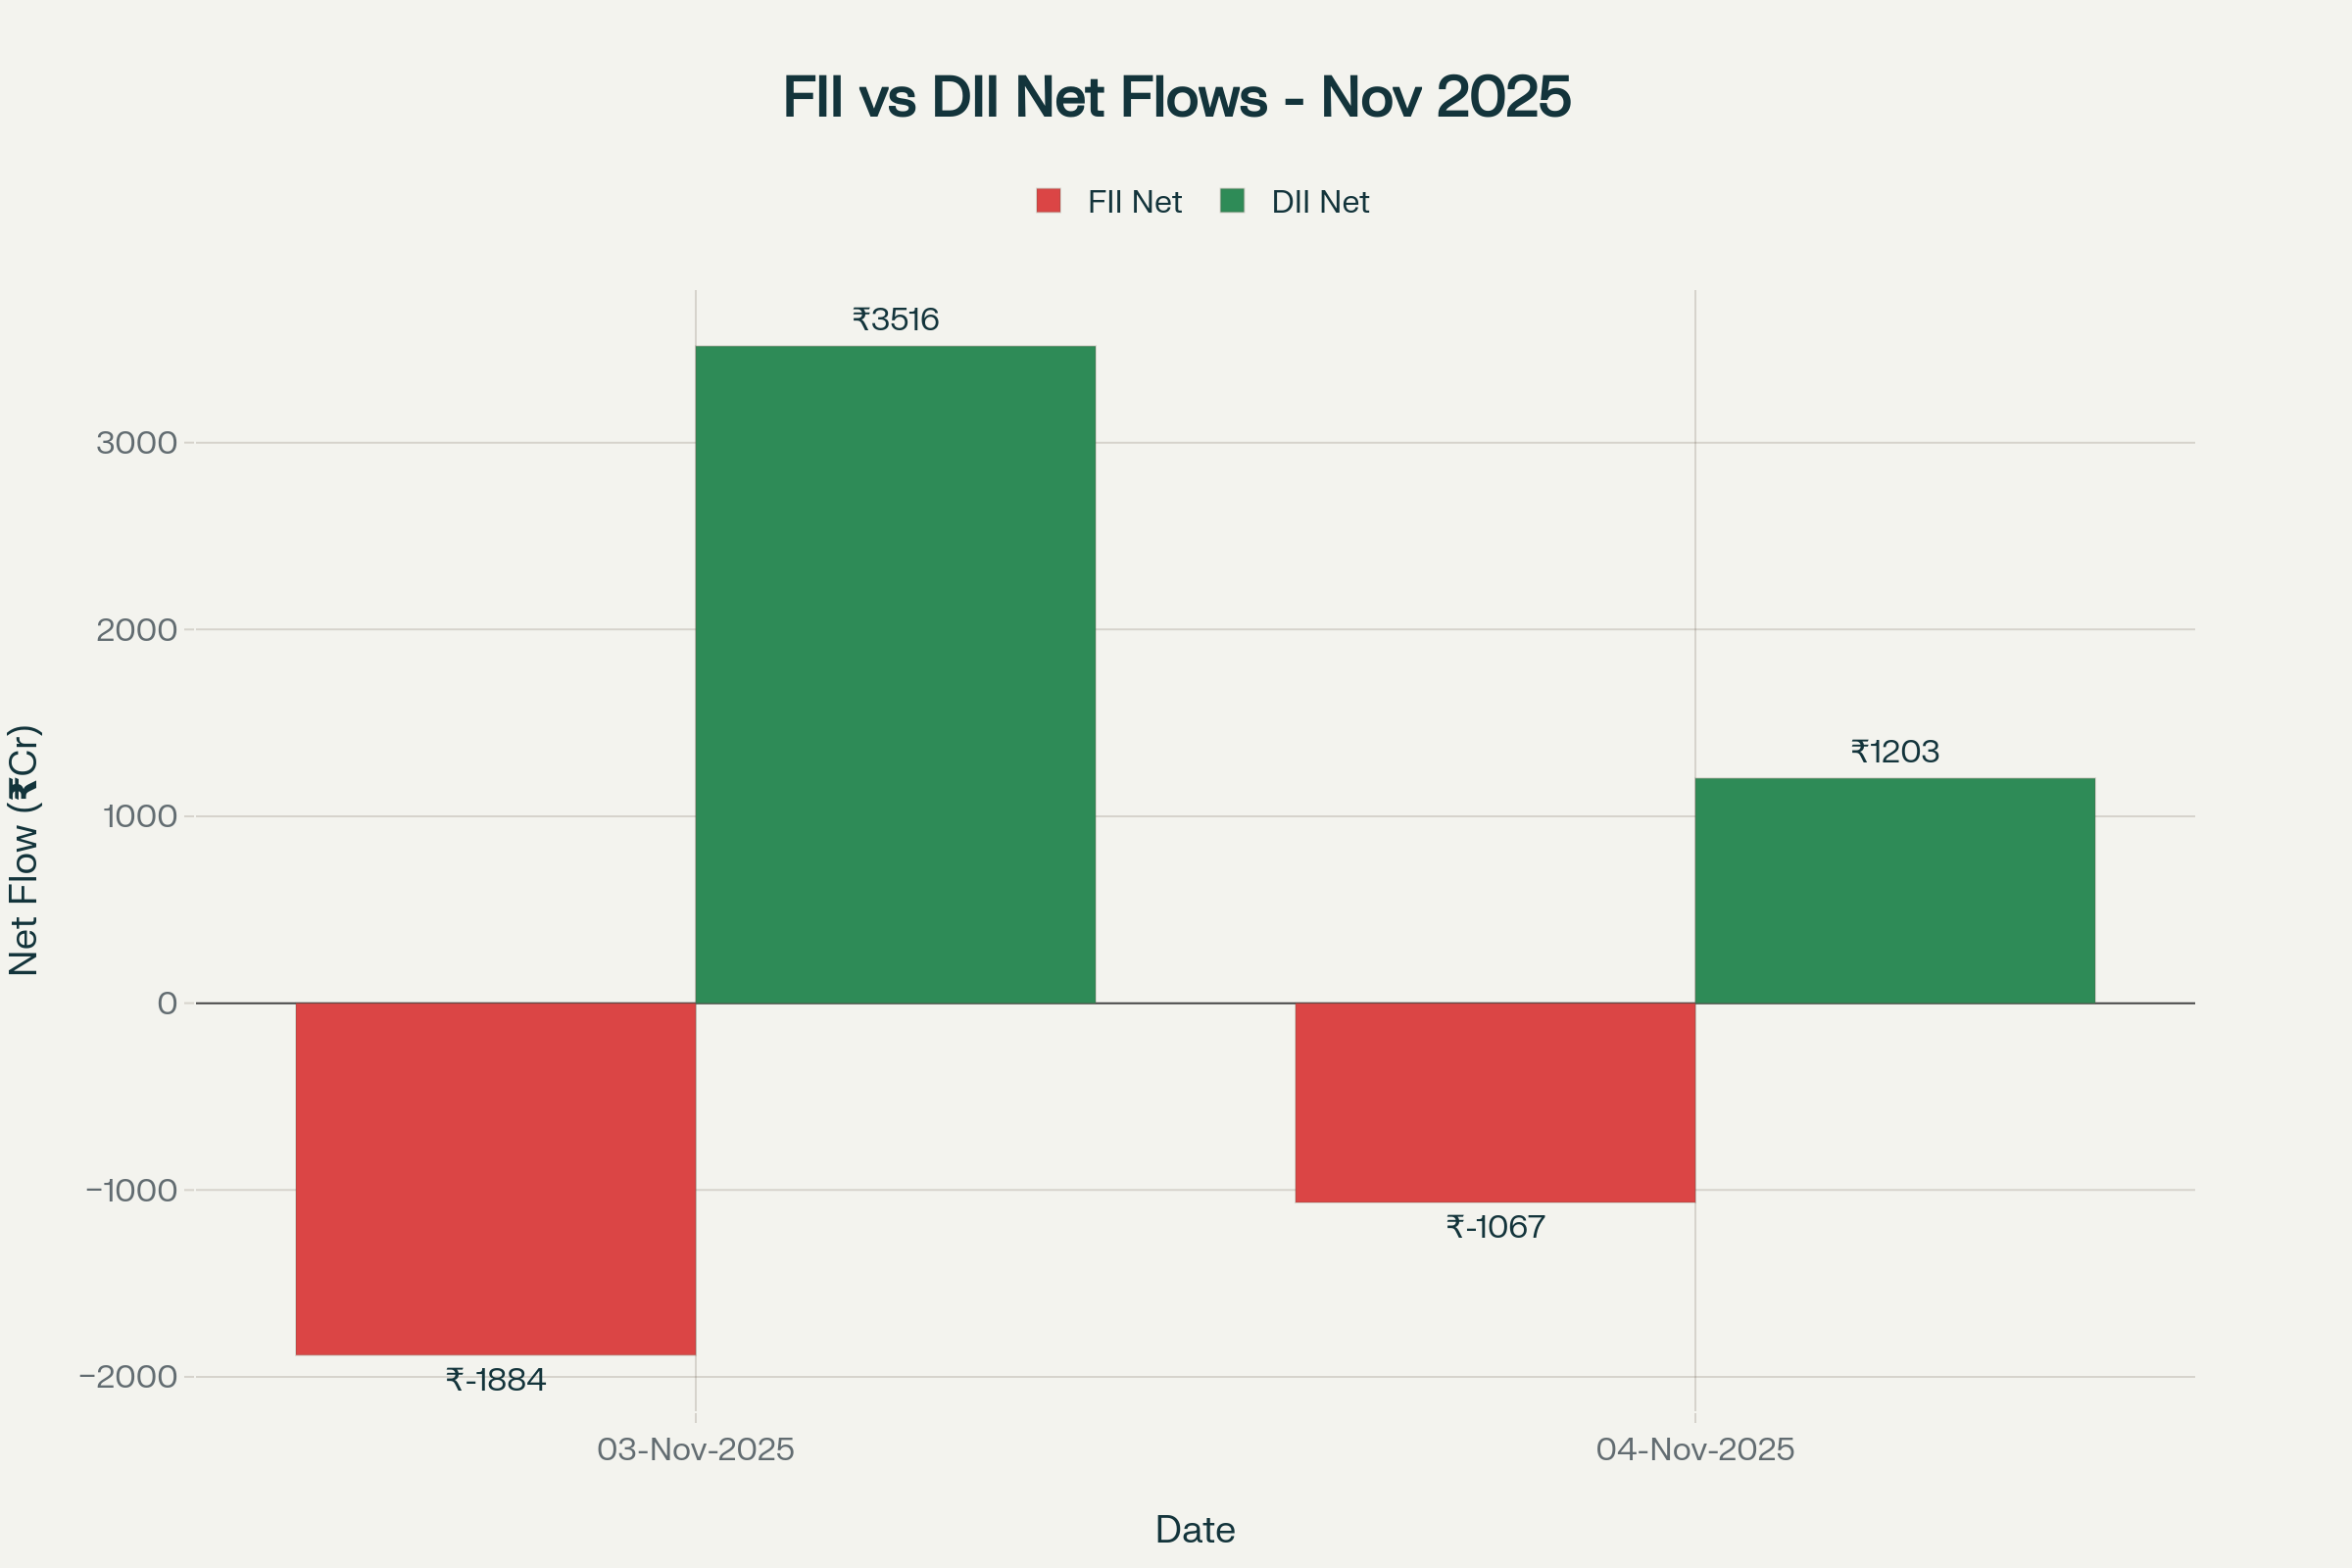 FII vs DII net flows showing continued foreign selling offset by strong domestic institutional buying in early November
Sectoral Performance: Narrow Leadership Amid Broad-Based Weakness
Tuesday’s session witnessed highly divergent sectoral performance, with only select pockets showing resilience while most segments faced selling pressure. The Nifty Consumer Durables Index emerged as the standout performer, rising 0.4% (151.9 points) to close at 38,654.95, driven by strong gains in Titan Company (up 2.39%), Kalyan Jewellers, and V-Guard, which advanced up to 2.4%. The consumer durables outperformance was supported by optimism about festive season demand and resilient consumer spending patterns.
The Nifty Telecom Index also bucked the broader trend, posting a gain of 0.15%, with Bharti Airtel advancing 1.89% to lead the sector higher. The telecom sector’s resilience reflected continuing subscriber additions and tariff optimization strategies being implemented by major operators.
On the flip side, the Nifty CPSE (Public Sector Enterprises) Index emerged as the worst performer, plummeting 1.70% (-112.5 points) to 6,494.1. NBCC Ltd led the declines with a 3.1% drop, followed by significant losses in Power Grid Corporation (down 3.11%), Coal India (down 2.83%), and ONGC (down 2.20%). The sharp correction in PSU stocks reflected profit-booking after recent strong gains and concerns about execution challenges in government projects.
The Nifty Capital Markets Index slipped 1.52% (-69.05 points) to 4,527.35, dragged down by CDSL, KFin Technologies, and CAMS, which fell as much as 3.4%. The Nifty India Defence Index also closed lower by 1.50% (-121.8 points) at 8,053.10, reflecting sector-specific profit-taking after the previous strong rally.
The IT sector declined 0.51%, weighed down by concerns about discretionary spending in developed markets and the impact of a stronger U.S. dollar on export competitiveness. The Metal sector fell 1.01%, while Auto, FMCG, Power, and Realty sectors all registered declines ranging from 0.68% to 0.92%, reflecting broad-based selling pressure across the market.
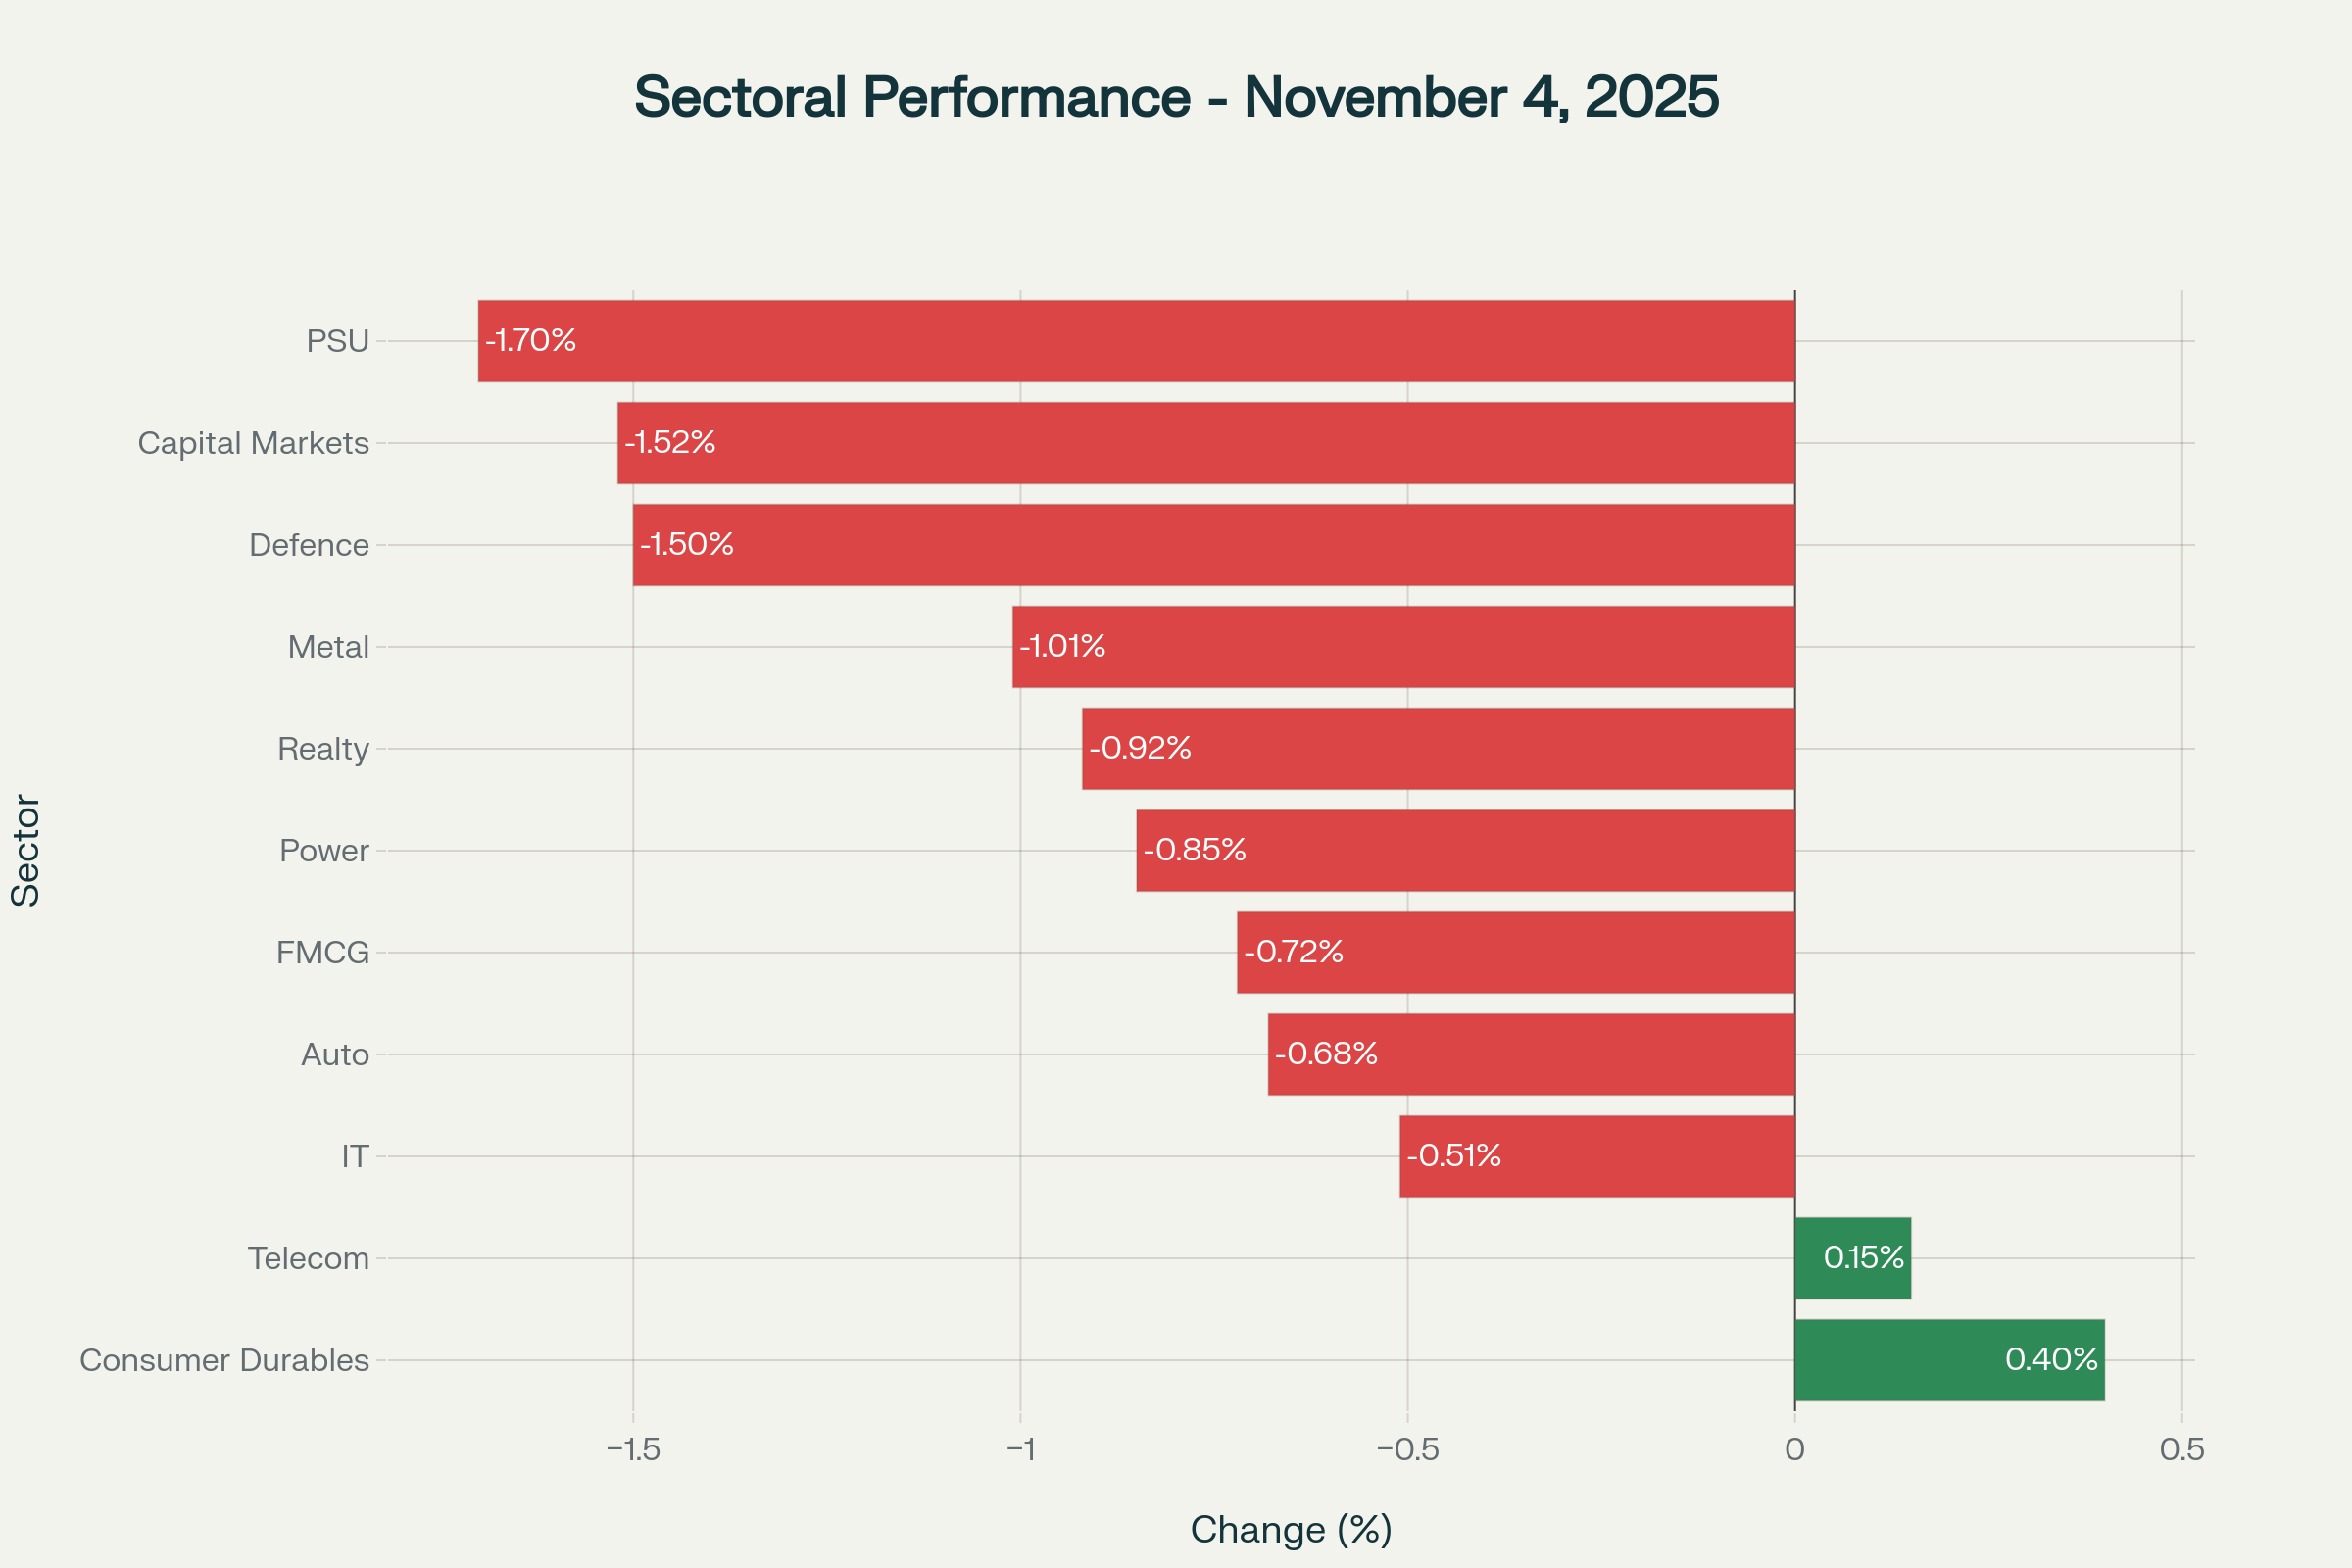 Sector-wise performance revealing widespread selling pressure with only consumer durables and telecom showing resilience
Global Market Cues: Risk-Off Sentiment Grips Global Equities
The global market environment turned decidedly cautious in Tuesday’s U.S. session and continued into Wednesday’s Asian trading, with risk-off sentiment driving selling across multiple asset classes. U.S. equity markets faced significant pressure, with the Dow Jones Industrial Average declining 0.31% to close at 42,454.79, while the S&P 500 fell 1.12% to 5,712.20. The Nasdaq Composite bore the brunt of the selloff, plummeting 2.04% to 17,899.01, as concerns about elevated AI valuations and warnings from top Wall Street bank CEOs about potential market corrections dampened risk appetite.
The market decline came despite strong earnings from major technology companies, suggesting that investor focus has shifted from corporate fundamentals to broader concerns about market valuations and economic uncertainty. Federal Reserve officials’ signals about exercising caution toward further interest rate cuts added to the nervous market mood, with traders now pricing in only a 69% probability of a 25 basis point rate cut in December, down from around 90% before the October FOMC decision.
Asian markets presented a mixed picture on Wednesday, with the Nikkei 225 in Japan declining 0.60% to 37,799.97, as profit-taking followed recent gains. The Hang Seng in Hong Kong bucked the trend, rising 0.51% to 23,603.15, supported by bargain hunting in select technology and property stocks. The Shanghai Composite edged lower 0.45% to approximately 3,850, reflecting continued caution about China’s economic recovery trajectory despite recent stimulus measures.
European markets also traded lower, with the FTSE 100 in London declining 0.52% to 8,644.44, and the DAX in Germany falling 1.37% to 22,527.01. The broad-based weakness across European indices reflected concerns about the region’s economic growth outlook, particularly given the ongoing challenges in the manufacturing sector and uncertainty about monetary policy trajectories.
The U.S. Dollar Index (DXY) remained elevated above 100, hovering near its highest level since May, as global risk-off sentiment drove demand for the safe-haven currency. The greenback drew additional support from speculation that the Federal Reserve may hold rates steady in December, following officials’ cautious commentary about further easing. Against the Indian rupee, the dollar traded around ₹88.56-88.73, near record lows for the rupee, putting pressure on import-dependent sectors and adding to inflation concerns.
Crude Oil and Commodity Markets: Persistent Weakness on Supply Glut
Crude oil prices remained under sustained pressure, heading toward a third consecutive monthly decline as oversupply concerns, robust U.S. inventory builds, and a stronger dollar weighed on energy markets. WTI crude oil futures edged up marginally by 0.11% to around $59.66 per barrel on November 6, while Brent crude rose 0.04% to $63.54 per barrel, though both benchmarks remain near multi-month lows.
The persistent weakness in oil prices reflects several converging factors. API data showed U.S. crude stocks surged by 6.5 million barrels in the week ending November 4, far exceeding expectations for a 2.4 million barrel draw and marking the largest weekly build since early July. This inventory accumulation signals weak demand despite the onset of winter in the Northern Hemisphere, raising concerns about global consumption patterns.
Additionally, OPEC+ decided on a modest output increase for December but paused further hikes from January to March, citing expectations of a 2026 surplus amid rising OPEC and non-OPEC supply. The cartel’s cautious approach acknowledges the delicate balance between maintaining price support and not ceding market share to non-OPEC producers, particularly U.S. shale operators.
China, India, and Turkey’s pause in purchases of sanctioned cargoes as they seek alternative supplies has further disrupted traditional oil trade flows, adding to price uncertainty. The stronger U.S. dollar and broader market selloff have also contributed to downward pressure on oil prices, as commodities priced in dollars become more expensive for holders of other currencies.
For the Indian economy, lower crude prices present a mixed blessing. On one hand, reduced oil import costs help ease the current account deficit and provide relief on inflation, benefiting sectors like aviation, logistics, and downstream chemicals. On the other hand, the weakness reflects concerns about global demand growth, which could signal broader economic slowdown that may impact India’s export-oriented sectors.
Gold prices remained range-bound near elevated levels, trading around ₹78,500 per 10 grams in the domestic market, as investors balanced safe-haven demand against reduced expectations for aggressive Fed easing. The precious metal has found support from ongoing geopolitical tensions and risk-off sentiment, though the stronger dollar has capped significant upside momentum.
Market Outlook for November 6: Cautious Recovery Attempt Expected
Looking ahead to Thursday’s trading session, market participants should prepare for a cautiously positive opening, with GIFT Nifty futures trading around 25,754.50, indicating a potential gap-up of approximately 46 points from Tuesday’s close. However, the overall bias for the session remains neutral to slightly positive, with the market likely to remain range-bound as traders assess the sustainability of support levels and await fresh catalysts.
The Nifty 50 is expected to trade in a consolidation phase between 25,500 and 25,750-25,800, with the ability to defend the 25,500 support zone being critical for maintaining market stability. Traders should view the 25,500-25,525 zone as a potential buying opportunity for short-term positions, though strict stop-losses below 25,450 are essential given the weak technical structure.
A sustained move above 25,700-25,750 would be essential to revive bullish momentum and signal that the correction phase may be concluding. However, failure to hold above 25,500 could invite further weakness toward the 25,400-25,448 zone, representing the previous swing high and a more substantial support area.
For the Bank Nifty, the 57,700-58,100 range defines the immediate trading corridor for Thursday’s session. The banking index’s ability to defend 57,700 will be crucial in maintaining overall market stability, given its significant weightage in benchmark indices. A breakout above 58,100 could trigger short-covering rallies toward 58,250-58,500, while a breakdown below 57,700 may lead to a test of 57,500 and potentially 56,970.
Several factors warrant close monitoring during Thursday’s session. First, any fresh developments on global trade negotiations or Fed policy commentary could provide directional cues and trigger volatility. Second, corporate earnings announcements from major companies including LIC, Ola Electric, and select IT firms will influence sector-specific sentiment and broader market mood.
Third, institutional flow patterns will continue to play a decisive role, with sustained DII buying providing crucial support against potential FII selling. Fourth, the ongoing government shutdown in the United States, now the longest in history, continues to delay key economic data releases, adding to uncertainty about the U.S. economic trajectory.
Trading Strategy and Risk Management Imperatives
Given the prevailing technical weakness and uncertain global backdrop, a prudent trading approach for November 6 emphasizes capital preservation, strict risk management, and tactical positioning rather than aggressive directional bets. Traders should consider the following strategic guidelines:
For Nifty traders, maintaining tight stop-losses below 25,450 for long positions and above 25,750 for short positions would help manage risk in the current volatile environment. Positional traders with a bullish bias could consider accumulating quality large-cap stocks on dips toward the 25,500-25,525 support zone, while remaining prepared to exit if support breaks decisively.
Swing traders might prefer to remain on the sidelines until a clear breakout above 25,750 or breakdown below 25,450 materializes, providing higher-probability directional setups. The current environment of choppy, range-bound trading with weak momentum favors patience over aggressive position-taking.
Options strategies appear particularly attractive in the current scenario, with option spreads, iron condors, and hedged positions around the 25,500-25,700 range offering favorable risk-reward profiles. Given the strong put writing at 25,500 and call writing at 25,700, option sellers might find opportunities in selling out-of-the-money options near these strikes, though maintaining appropriate position sizing and risk controls is essential.
Sector rotation strategies could prove beneficial, with selective accumulation in defensive sectors like FMCG, Healthcare, and select Consumer Durables on dips, while maintaining exposure to Telecom which has shown relative strength. However, avoiding overweight positions in the beaten-down PSU, Capital Markets, and Defence sectors would be prudent until technical and fundamental indicators show signs of stabilization.
From a derivatives perspective, traders should closely monitor changes in open interest across different strike prices and any shifts in implied volatility patterns. Significant unwinding of put positions at support levels or aggressive call writing near resistance zones could signal impending weakness, warranting defensive adjustments to existing positions.
Broader Economic Context and Medium-Term Considerations
While near-term technical weakness and global uncertainty dominate current market sentiment, the medium-term outlook for Indian equities retains a constructive bias, supported by several enduring structural factors. The Indian economy continues to demonstrate resilience relative to global peers, with domestic demand drivers remaining robust despite external headwinds.
The IMF’s October 2025 World Economic Outlook projects global growth to slow from 3.3% in 2024 to 3.2% in 2025 and 3.1% in 2026, with advanced economies growing around 1.5% and emerging markets maintaining growth above 4%. India is expected to outperform most major economies, benefiting from favorable demographics, ongoing infrastructure investments, and digital economy expansion.
However, several medium-term risks merit careful attention. Elevated valuations across mid-cap and small-cap segments, despite the recent correction, suggest limited margin of safety and vulnerability to further profit-taking. The Nifty earnings outlook shows concerning divergences, with 52% of Nifty50 companies experiencing EPS downgrades in October 2025, up from 36% in September. Among larger sectors, higher earnings cuts were seen in Insurance (100%), Consumer (88%), Metals & Mining (75%), IT Services (60%), and Pharmaceuticals (60%).
The global trade environment remains fraught with uncertainty, as evidenced by the dramatic increase in U.S. tariffs in 2025 that has led to volatility and disruptions in trade data. The U.S. effective tariff rate has surged from under 5% in 2024 to around 17% in the latest data, creating broad-based headwinds for global trade growth. While some extremes of higher tariffs were tempered through subsequent deals, the overall environment remains volatile, with China’s exports shifting away from the U.S. toward other markets including India.
The rupee’s persistent weakness against the dollar, trading near 88.56-88.73 levels, poses challenges for import-dependent sectors and could add to domestic inflation if sustained. While the Reserve Bank of India maintains adequate forex reserves to manage currency volatility, the combination of persistent FII outflows and a strong dollar environment tests the central bank’s tolerance for currency depreciation.
On the positive side, select sectors are seeing earnings upgrades, with Oil and Gas (100%) and NBFC (75%) companies leading improvements. This sectoral divergence suggests that opportunities exist for stock-specific investors who can identify companies benefiting from structural tailwinds despite broader market challenges.
Conclusion
As Indian markets resume trading on November 6, 2025, after the mid-week holiday, investors confront a complex landscape characterized by technical consolidation, persistent foreign selling, and cautious global sentiment. The Nifty’s breakdown below the 20-day EMA and formation of bearish candlestick patterns signal that short-term momentum has turned negative, warranting defensive positioning and strict risk management.
The immediate focus remains on the 25,500-25,750 range for Nifty and 57,700-58,100 for Bank Nifty, with breakouts or breakdowns from these levels determining the near-term trajectory. Sustained support from domestic institutional investors provides a crucial cushion, though the ability of DIIs to continue absorbing FII selling in the face of weakening technical indicators remains uncertain.
For traders and investors, the current environment demands disciplined risk management, selective sector allocation, and patience in awaiting high-probability setups. While near-term volatility may persist as markets digest the technical correction and global uncertainties, India’s strong economic fundamentals, resilient domestic demand, and attractive long-term growth prospects continue to support a constructive medium-term outlook for equity markets.
Thursday’s session will be critical in determining whether the correction stabilizes at current support levels or extends deeper toward the 25,400-25,200 zone. Market participants should remain vigilant, monitor institutional flows closely, and be prepared to adjust positions as new information emerges about both domestic technical dynamics and global macro developments.
Analyst Name: Pradeep Suryavanshi
Bestmate Investment Services Pvt. Ltd.:
A-1-605, Ansal Corporate Park Sec-142, Noida 201305
CIN: U74999UP2016PTC143375
SEBI Registration Number: INH000015996
Website: www.bestmate.in I Email: info@bestmate.in
Download Report :- Nifty OL 31-10-2025
Disclaimer: Please read the Following very carefully:
“Investments in securities market are subject to market risks. Read all the related documents carefully before investing.”
- Registration granted by SEBI and certification from NISM in no way guarantee performance of the intermediary or provide any assurance of returns to investors.
- The fees are paid for research Report or Research recommendations and is not refundable or cancellable under any circumstances.
- We do not provide any guaranteed profit or fixed returns or any other services. We charge fixed fees and do not operate on any profit-sharing model.
- Images if any, shared with you are for illustration purposes only.
- We are not responsible for any financial loss or any other loss incurred by the client.
- Please be fully informed about the risk and costs involved in trading and investing. Please consult your investment advisor before trading. Trade only as per your risk appetite and risk profile.
- Trading/investing in stock market is risky due to its volatile nature. Upon accepting our service, you hereby accept that you fully understand the risks involved in trading/investing.
- We advise the viewers to apply own discretion while referring testimonials shared by the client. Past performances and results are no guarantee of future performance.
- All Report or recommendations shared are confidential and for the reference of paid members only. Any unapproved distribution of sensitive data will be considered as a breach of confidentiality and appropriate legal action shall be initiated.
- The Research Report or recommendations must not be used as a singular basis of any investment decision. The views do not consider the risk appetite or the particular circumstances of an individual investor; readers are requested to take professional advice before investing and trading. Our recommendations should not be construed as investment advice.
- In case of any query, please email on Info@bestmate.in be rest assured, our team will get back to you and resolve your query. Please state your registered phone number while mailing us.
- Reports based on technical and derivative analysis center on studying charts of a stock’s price movement, outstanding positions and trading volume, as opposed to focusing on a company’s fundamentals and, as such, may not match with a report on a company’s fundamentals.
Disclosure Document
The particulars given in this Disclosure Document have been prepared in accordance with SEBI(Research Analyst)Regulations,2014.The purpose of the Document is to provide essential information about the Research and recommendation Services in a manner to assist and enable the prospective client/clients in making an informed decision for engaging in Research and recommendation services before investing.For the purpose of this Disclosure Document, Research Analyst is Pradeep Suryavanshi Director, of Bestmate Investment Services Pvt Ltd (hereinafter referred as “Research Analyst”)
Business Activity: Research Analyst is registered with SEBI as Research Analyst with Registration No. INH000015996. The firm got its registration on and is engaged in research and recommendation Services. The focus of Research Analyst is to provide research and recommendations services to the clients. Analyst aligns its interests with those of the client and seeks to provide the best suited services.
Terms and conditions:
The Research report is issued to the registered clients. The Research Report is based on the facts, figures and information that are considered true, correct and reliable. The information is obtained from publicly available media or other sources believed to be reliable. The report is prepared solely for informational purpose and does not constitute an offer document or solicitation to buy or sell or subscribe for securities or other financial instruments for clients.
Disciplinary history:
- No penalties/directions have been issued by SEBI under the SEBI Act or Regulations made there under against the Research Analyst relating to Research Analyst services.
- There are no pending material litigations or legal proceedings, findings of inspections or investigations for which action has been taken or initiated by any regulatory authority against the Research Analyst or its employees.
Details of its associates:- No associates
Disclosures with respect to Research Reports and Research Recommendations Services
- The research analyst or research entity or his associate or his relative do not have financial interest in the subject company.
- The research analyst or its associates or relatives, do not have actual/beneficial ownership of one per cent or more securities of the subject company, at the end of the month immediately preceding the date of publication of the research report or date of the public appearance.
- The research analyst or his associate or his relative do not have any other material conflict of interest at the time of publication of the research report or at the time of public appearance.
- The research analyst or its associates have not received any compensation from the subject company in the past twelve months.
- The research analyst or its associates have not managed or co-managed public offering of securities for the subject company in the past twelve months.
- The research analyst or its associates have not received any compensation for investment banking or merchant banking or brokerage services from the subject company in the past twelve months.
- The subject company was not a client of Research Analyst or its employee or its associates during twelve months preceding the date of distribution of the research report and recommendation services provided.
- The research analyst or its associates have not received any compensation for products or services other than investment banking or merchant banking or brokerage services from the subject company in the past twelve months.
- The research analyst or its associates have not received any compensation or other benefits from the subject company or third party in connection with the research report.
- The research analyst has not been engaged in market making activity for the subject company.
- The research analyst has not served as an officer, director or employee of the subject company.
The research analyst did not receive any compensation or other benefits from the companies mentioned in the documents or third party in connection with preparation of the research documents. Accordingly, research Analyst does not have any material conflict of interest at the time of publication of the research documents.